18.0 Performance Monitoring, Evaluation, and Reporting
- 18.1 What Is Included?
- 18.2 Why Monitor, Evaluate, and Report Performance?
- 18.3 Level of Effort
- 18.4 Complementarity/Consistency with Other Transportation Goals
- 18.5 Who—Roles and Responsibilities
- 18.6 Setting a Process for Monitoring, Evaluation, and Reporting
- 18.7 Process, Output, and Outcome Metrics
- 18.8 Updating Inventories
- 18.9 Postimplementation Strategy Evaluation
- 18.10 Revising Targets
- 18.11 Internal Reporting
- 18.12 Reporting to External Stakeholders and the Public
- 18.13 Self-Assessment: Performance Monitoring, Evaluation, and Reporting
18.1 What Is Included?
This section covers agencywide monitoring, evaluation, and reporting of progress on achieving greenhouse gas (GHG) reduction goals. These terms are used as follows:
- Monitoring—Periodically estimating transportation GHG emissions and comparing them with past trends, projections, and targets, as well as tracking the status of activities proposed to reduce GHG emissions.
- Evaluation—Considering the extent to which various GHG reduction activities have or have not been successful and factors contributing to success (or lack thereof).
- Reporting—Presenting and interpreting information learned from monitoring and/or evaluation to agency staff, elected officials and other decision-makers, other stakeholders, and the public.
18.2 Why Monitor, Evaluate, and Report Performance?
To quote a long-standing truism, “What gets measured is what gets done.” The Moving Ahead for Progress in the 21st Century Act (MAP‑21) placed a new emphasis on performance management to introduce accountability and transparency into transportation decision-making, improve the performance of the transportation system, and achieve better returns on investment as measured in terms of social, environmental, and economic outcomes. While there are no Federally required GHG performance measures for transportation agencies at the time of this writing, a monitoring, evaluation, and reporting program is nevertheless essential if a State is to determine how well it is doing at meeting any GHG reduction goals or targets, what management initiatives are needed, and what needs improvement. Reporting of progress on GHG emissions can provide agency staff, elected officials, stakeholders, and the public with information to judge the overall success of implemented policies and assess where further action may be needed based on the degree to which targets are being met. Performance monitoring is therefore a part of the “Plan/Do/Check/Act” cycle discussed in Section 19.0 and provides a critical feedback loop from information to action.
GHG emissions are very difficult to measure directly. Instead, they are typically estimated using a combination of observed data (such as vehicle travel or material volumes) and modeled data (such as emission factors). “Monitoring” is therefore not a true measurement, but rather a combination of monitoring what can be observed with employing methods (also applied in forecasting) to estimate what cannot be directly observed.
Standardization of data, methods, and assumptions (for example, fuels and materials emission factors) is important for ensuring accurate evaluation and reporting and minimizing duplication of effort.
18.3 Level of Effort
The level of effort for GHG monitoring, evaluation, and reporting depends upon the data sources used, the level of evaluation conducted, and the frequency with which results are reported. Savings and efficiencies may also be realized by combining these activities with ongoing efforts such as the preparation of routine monthly or annual reports.
Monitoring—The level of effort for monitoring progress on reducing GHG emissions can be minimized by aligning data and methods with those used for the development of a baseline inventory, ongoing efforts such as reducing traffic management and vehicle miles traveled (VMT), regional conformity determinations, or project-level environmental studies. With this kind of alignment, it becomes a matter of updating the GHG estimates whenever the underlying data are updated. For example, this might be when annual fuel sales data are released or when the travel demand model is rerun for a more current year.
Evaluation—Qualitative evaluation of GHG reduction activities may be performed with a relatively modest effort; for example, review of monthly progress reports or interviewing engaged staff to determine which action items have been successfully implemented, which have not, and why. A rigorous quantitative evaluation—for example, estimating GHG reductions from specific activities or projects based on ex post data—generally requires a larger effort. It may be desirable to selectively evaluate major projects for which actual GHG effects are highly uncertain to better inform future decision-making. Evaluation of GHG benefits may also be coordinated with evaluation of other benefits such as congestion relief and reduction of criteria pollutants.
Reporting—The level of effort for reporting will depend upon the amount of information reported, frequency of updates, opportunities for consolidation with other reports, and communication method. An online “dashboard” may require more setup time but less effort to update on an ongoing basis when compared to a stand-alone annual or biennial publication.
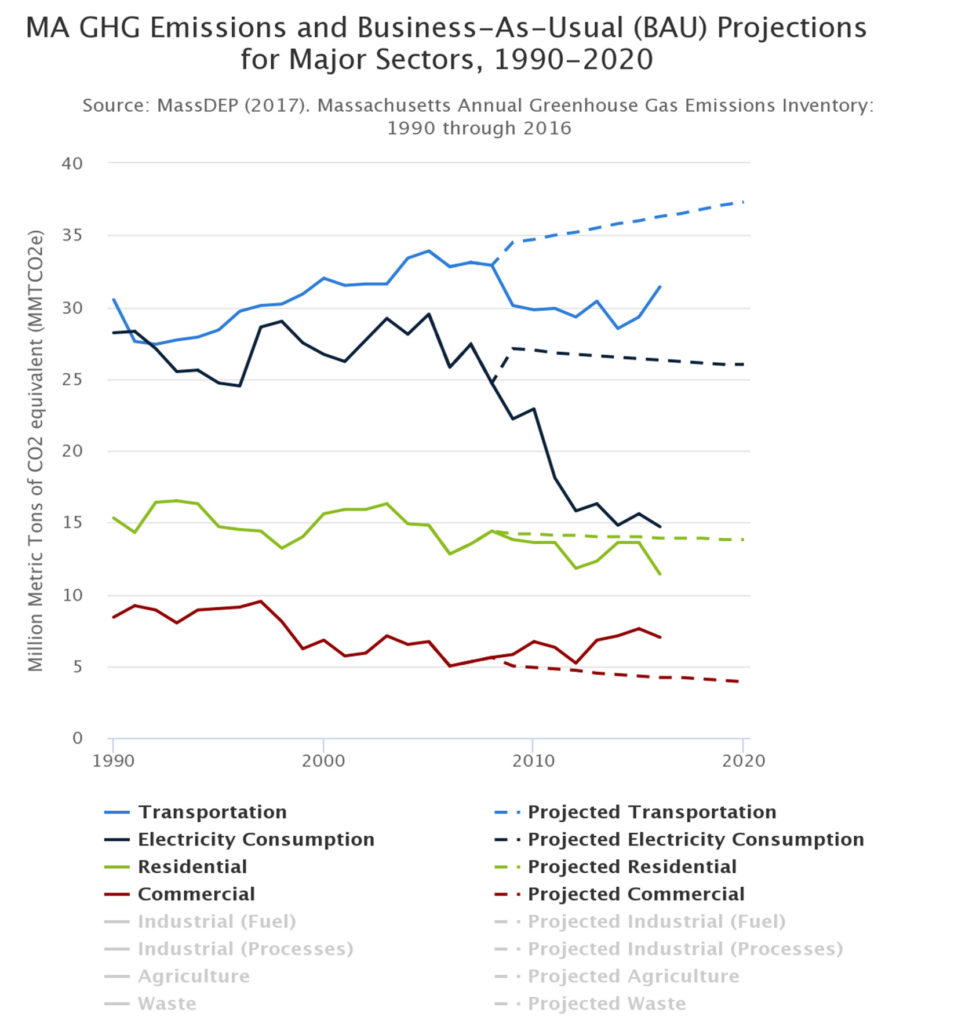
Figure 18.1 shows an example of statewide monitoring as presented on a dashboard. This graphic from the Commonwealth of Massachusetts’s website on GHG emission trends shows that substantial progress has been made at reducing emissions from the electricity sector, but transportation and commercial emission reductions have lagged.
Figure 18.1 Example of Statewide GHG Monitoring Report
18.4 Complementarity/Consistency with Other Transportation Goals
Monitoring, evaluation, and reporting of GHG emission reduction activities and outcomes may be able to leverage activities for related purposes, such as preparation of an annual agencywide performance monitoring report that meets Federal, State, and/or local requirements. Evaluation of the success of GHG reduction activities may also support evaluation of success at meeting other metrics—such as congestion reduction, increased travel options, or air quality improvement—when implemented strategies have multiple benefits. The agency already may have initiatives to standardize and ensure consistency in data governance and performance monitoring; GHG reporting can be folded into these initiatives.
18.5 Who—Roles and Responsibilities
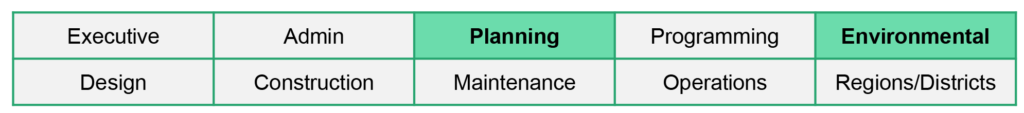
The office responsible for the GHG program—whether housed in the Executive, Planning, Research, Environmental, or another branch—will need to set overall direction for monitoring and reporting, including responsibilities for coordinating data collection and methods across the agency.
The Planning and/or Environmental units are most likely to have the primary responsibility for monitoring, evaluation, and reporting. The Environmental unit will likely help with providing and updating data such as emission factors. Other data, such as travel activity and postimplementation studies, will likely be provided by the Planning unit.
Responsibilities for monitoring emissions may depend on the data sources and methods used for inventory development and extend outside the department of transportation (DOT). For example, a multisector fuels-based inventory is most likely the responsibility of the State environmental or energy agency. Coordination will be needed with other functional areas on data collection and analysis.
Overall evaluation of GHG reduction activities should be the responsibility of the DOT office responsible for coordinating GHG activities. Various units may contribute data and methods to evaluation of specific projects and activities, as appropriate.
Technical staff responsible for monitoring may also be involved in the preparation of reports. In addition, the Communications office of the DOT should be involved in any public-facing reporting activities.
18.6 Setting a Process for Monitoring, Evaluation, and Reporting
Agency staff responsible for coordinating GHG reduction activities should develop a monitoring, evaluation, and reporting program with the following considerations:
- Is there a legislative or executive requirement for reporting? At what frequency? What contents are required?
- Who are the intended audience(s) for the reporting? How might the information needed differ by audience?
- What specific metrics will be reported, and how will they be estimated or calculated?
- How often, and when, are the underlying data required to compute these metrics updated?
- Are any new data collection or computational procedures required?
- What efforts are needed to coordinate and standardize data collection and analysis across functional areas?
- Through what media will reports by published? How will interested parties be made aware of their publication or update?
- Are there existing performance monitoring and reporting activities with which GHG performance monitoring and reporting can be coordinated?
- Are the resources available for reporting adequate to meet any requirements or desired outcomes in terms of frequency, level of detail, robustness of data, etc.?
- How is monitoring being used to adjust DOT or other state actions?
18.7 Process, Output, and Outcome Metrics
Performance measures may focus on processes, outputs, or outcomes.
- Process measures relate to following specific procedures or including certain practices, such as the regular engagement of key partners in GHG reduction activities.
- Product or output measures relate to how much of a product is produced, such as number of electric vehicle (EV) charging stations, miles of new or improved bicycle facilities, or proportion of pavement made from recycled material.
- Outcome measures relate to the ultimate effect of interest—in this case, GHG emission reductions or a proxy measure, such as reduced VMT or petroleum fuel use.
An agency must evaluate each performance measurement option and determine the most effective focus. For example, outcome measures are of ultimate interest in terms of the benefits of GHG reduction activities. However, output measures can be harnessed to provide an important metric of intermediate program accomplishments, especially when it is difficult to directly link outcomes to program activities. Process indicators may be used to assess the quality of engagement of key stakeholders.
The Federal Highway Administration (FHWA, 2013b) provides more discussion of options for GHG metrics.
18.8 Updating Inventories
The process of updating a GHG inventory can be the same as the process for monitoring emission trends. (Options for developing a transportation GHG inventory are described in Section 10.6.) Once a protocol is established for estimating GHG emissions from the most recent historical data, continuing to follow this protocol will ensure consistency in measurements.
In some cases, only selected elements of the underlying data may be updated on a frequent (e.g., annual) basis, or reporting may lag by 2 to 3 years. It therefore may be necessary to continue with previous years’ estimates from data sources that are not updated as often. When developing the monitoring plan, the agency should consider whether the lower frequency of data updates fundamentally compromises the accuracy of reporting, or whether the key variables most likely to change have been updated. In some cases, it may be necessary to delay reporting if the lack of current data is expected to have a major effect on accuracy or to at least clearly caveat the results.
18.9 Postimplementation Strategy Evaluation
Any number of ex post strategy evaluation approaches might be designed based on the strategy implemented. Examples are shown of EV infrastructure evaluation and traffic flow improvements evaluation.
EV Infrastructure Evaluation
The DOT has engaged in partnerships to deploy charging infrastructure at publicly accessible locations along major highway corridors. Evaluation metrics might include
- Process—Engagement of stakeholders in designing stations that encourage use (e.g., utilities, rest area vendors).
- Product—Number of charging points deployed, average distance between stations.
- Outcome—Quantity of electricity provided at stations, increase in EV traffic along corridors, and number of vehicles using the stations.
Traffic Flow Improvements Evaluation
The DOT has undertaken a systematic, triennial retiming of traffic lights on state roads, with the goals of reducing congestion, criteria pollutant emissions, and GHG. Evaluation metrics might include
- Process—Coordination with local jurisdictions where state/local roads intersect, providing funding for locally owned signals.
- Product—Number of intersections retimed compared to total inventory, traffic volumes affected.
- Outcome—Measurement of before-and-after speeds on sample routes via traffic monitoring systems, application of speed-based emission factors to estimate GHG changes.
A Performance-Based Approach to Addressing Greenhouse Gas Emissions through Transportation Planning (FHWA, 2013b) contains eight pages of material discussing system-level evaluation and project/program analysis (including cost-effectiveness and co-benefits). Confounding issues are discussed.
18.10 Revising Targets
One important function of monitoring is to consider whether any targets set for GHG reduction may need to be revised. Another is to gauge the ongoing need for additional support or resources to produce the desired results. Targets are usually set by other agencies or through collaborative efforts, but the State DOT may be an important partner in the target-setting process.
Revision of targets should not be taken lightly, as these are typically set based on scientific understanding of what level of GHG emission reductions are needed globally to avoid unacceptable levels of economic and environmental damage from climate change. A trend line that is falling short of targets may warrant more aggressive efforts.
Conversely, there may be situations in which progress is made more quickly than expected, and targets may be revised to be more aggressive and set a higher bar. For example, this has been seen in the electricity generation sector, where falling natural gas prices and other regulatory and economic factors have led to a substantial decline in carbon dioxide (CO2) emissions from power generation. Reduction of targets in strongly performing sectors can help to make up for deficiencies in sectors where GHG emission reductions are found to be more challenging than expected.
Figure 18.2 provides an example of a trend projection versus emissions estimated from actual (monitored) data for the electricity sector in Massachusetts. In this case, it is evident that the trend diverged strongly from expected patterns, helping the Commonwealth nearly achieve its 2020 GHG target by 2012.
Figure 18.2 Example of Trend Projection versus Monitored Data
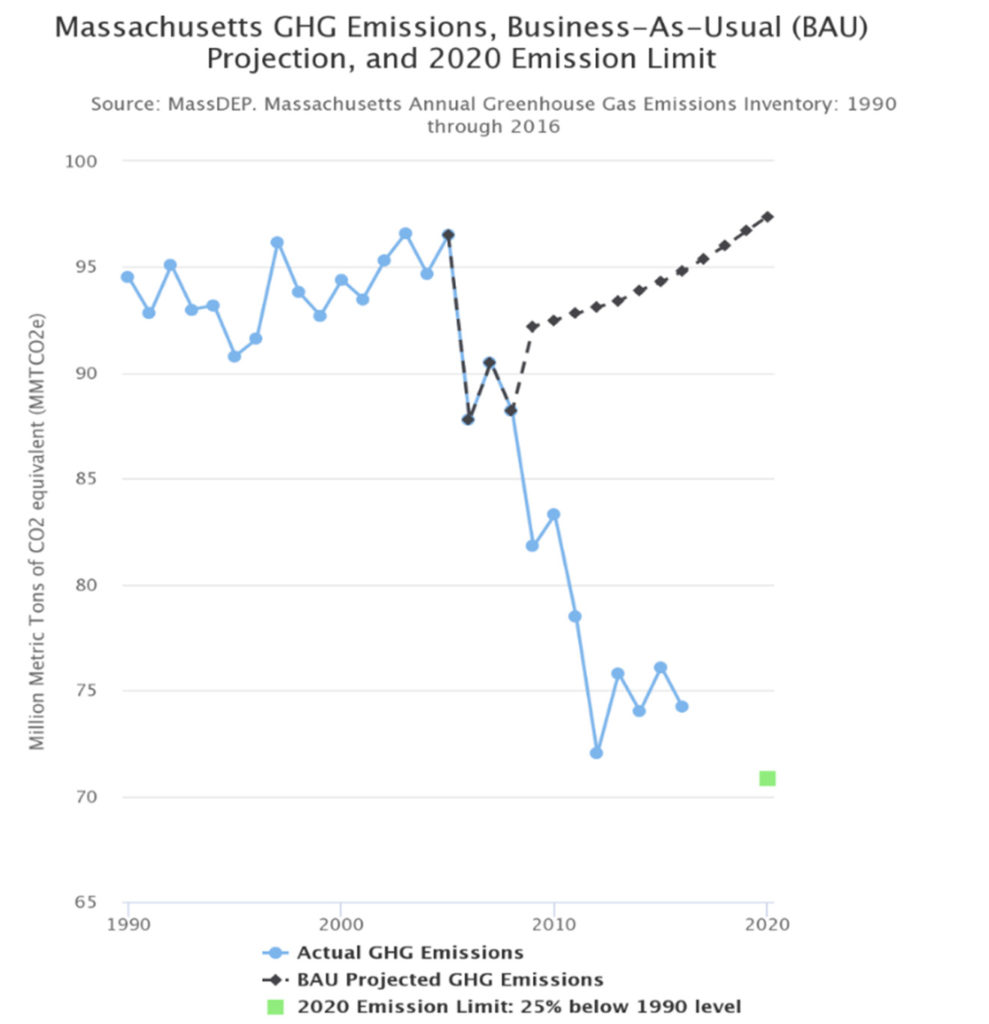
Source: https://www.mass.gov/service-details/ma-ghg-emission-trends.
18.11 Internal Reporting
Dashboards or performance reports may be created for the consumption of internal agency staff. Internal reporting is likely to focus on operational details that help agency staff determine how effectively they and their units are carrying out their responsibilities as part of the agency’s general “Plan, Do, Check, Act” improvement cycle (shown in Figure 18.3).
Figure 18.3 GHG Management Cycle: Internal Agency
| Plan | Set policy | Establish targets | Make assignments |
| Do | Develop procedures | Train staff | Implement |
| Check | Report | Consolidate reports | Evaluate performance |
| Act (Improve) | Check-in with partners | Explore alternatives | Revise procedures |
Source: Adapted from Using an Environmental Management System to Meet Transportation Challenges and Opportunities: An Implementation Guide (AASHTO, 2003) and Beyond the Short-Term—Transportation Asset Management for Long-Term Sustainability, Accountability and Performance (FHWA, 2010b).
18.12 Reporting to External Stakeholders and the Public
External dashboards or performance reports should communicate progress on selected key performance measures that will be of interest to decision-makers and the public, such as overall GHG emissions levels, emission reductions from specific GHG reduction programs, costs, and program activities (e.g., EV supply equipment deployment or miles of corridor with synchronized traffic control).
Reports designed for an external audience should be accompanied by any important explanatory information, such as goals and/or targets set through legislation or executive action and the DOT’s charge in carrying out GHG reduction activities. A high level of quality control may be necessary to ensure that incorrect information is not disseminated. Supporting documentation should be provided to describe data sources and methods. Full and transparent reporting can help to build public confidence and trust in the agency as well as inform public policy deliberations. See Section 8.0 for more discussion of communications related to GHG reduction efforts.
Minnesota Enterprise Sustainability Annual Report
The Minnesota Department of Administration maintains an online dashboard and produces an annual report on enterprise performance measurement of six sustainability metrics—fleet (including fuel efficiency, consumption, and alternative fuels/electricity), energy consumption, water use, solid waste, procurement (sustainable products), and GHG emissions. Metrics are reported for State agencies as a whole and for individual agencies, including the DOT.
Source: https://sustainability.mn.gov/.
18.13 Self-Assessment: Performance Monitoring, Evaluation, and Reporting
A self-assessment worksheet is provided to assist State DOT staff in determining where their agency falls on the GHG engagement spectrum for monitoring, evaluation, and reporting and what additional actions they may wish to take to improve these practices as they relate to GHG emissions estimation and reduction activities.
Click to download – Self-Assessment: 18.0 Performance Monitoring, Evaluation, and Reporting