10.0 Transportation Systems Planning
- 10.1 What Is Included?
- 10.2 Why Consider GHG at the Systems Level?
- 10.3 Level of Effort
- 10.4 Complementarity/Consistency with Other Transportation Goals
- 10.5 Who—Roles and Responsibilities
- 10.6 Inventory and Baseline Forecast Development
- 10.7 Goal and Target Setting
- 10.8 Strategy Identification
- 10.9 Strategy Evaluation
- 10.10 Implementation
- 10.11 Self-Assessment: Transportation Systems Planning
10.1 What Is Included?
“Transportation systems planning” includes planning for an entire network of transportation facilities and its users, including passenger and freight traffic. It includes the Federally mandated processes of statewide and metropolitan long-range planning. It may also include planning for specific geographies such as a corridor, subarea, county, or municipality; or it may include a specific modal focus such as highways, transit, pedestrian and bicycle, or rail. Greenhouse gas (GHG) assessment will usually be part of multimodal passenger and/or freight transport planning since many GHG reduction strategies involve shifting traffic among modes. GHG emissions considered at this level typically include emissions from all vehicles and users of the transportation system (or at least surface modes) and may also include emissions associated with construction and maintenance of projects identified and programmed through the planning process.
Systems planning is usually long-range (at least 20 years) but may include shorter-range planning such as operational assessments focusing on a 5- to 10-year timeframe. Systems-level GHG assessment may be conducted as part of the development of a long-range plan (or other systems plan) or as a stand-alone study (such as a climate action plan, clean energy plan, or GHG strategy) with recommendations that are incorporated into the next plan update.
10.2 Why Consider GHG at the Systems Level?
GHG assessment at the systems level is important because
- The process of developing an inventory and forecast of emissions from users of the transportation system will quantify the overall GHG emissions from the transportation sector, provide insights into the drivers of these emissions, and establish a baseline against which future changes can be measured.
- Systems-level policies and investments affect overall travel patterns and transportation technologies and therefore provide the greatest opportunity to reduce transportation GHG emissions. A strategy will be more effective the larger the number of vehicles affected.
- Development of a systems-level inventory and strategy assessment can provide data (such as emission rates or cost-effectiveness information) to inform programming, project development, and operations and maintenance activities.
- Many States develop and update broader climate action or clean energy plans that consider GHG emissions and strategies for all sectors, including transportation. The engagement of a transportation agency in systems-level GHG planning ensures that the agency and its partners (e.g., other State agencies) fully understand the opportunities and constraints and that the transportation agency’s viewpoint is considered when setting State or regional policy.
As shown in Figure 10.1, for a hypothetical “composite” State, GHG emissions from users of the system make up the vast majority (about 94 percent) of transportation-related emissions. While the department of transportation (DOT) has only a modest amount of ability to affect and control these emissions, strategies to reduce the large volume of emissions from the transportation sector are most effectively introduced in strategic and long-range planning and carried through to project decisions, programming, and other implementation activities.
Figure 10.1 Example State Transportation GHG Emissions by Type
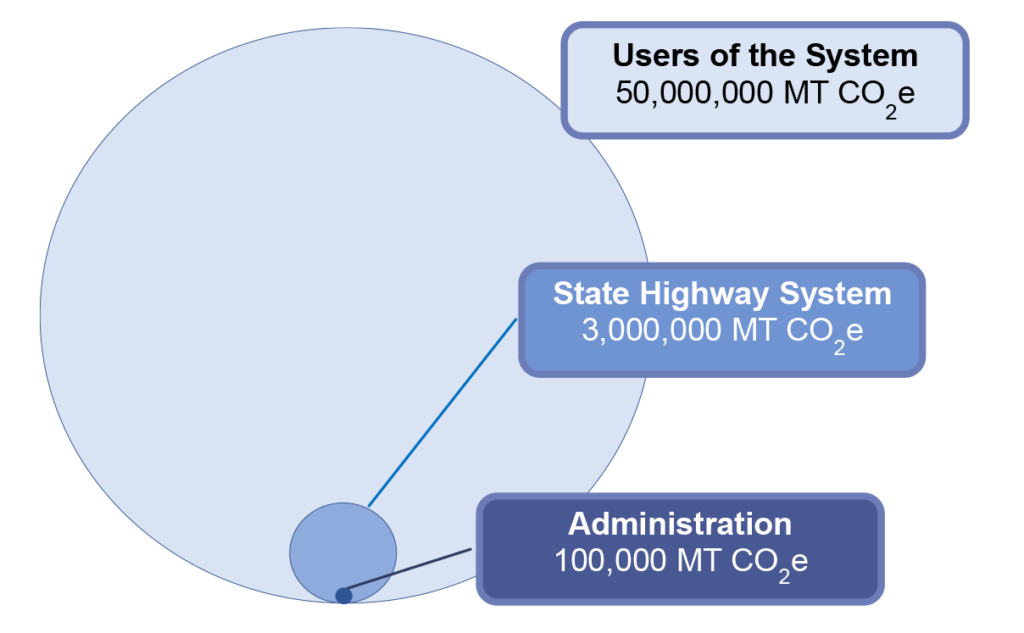
Source: Calculations by Good Company. Users of the system figure based on data from Florida, Maine, Massachusetts, Minnesota, Maryland, Oregon, Vermont, Washington, and Texas DOT sustainability/GHG inventory reports and system characteristics, including vehicle miles traveled (VMT), population, lane miles, and fuel mix. State highway system figure based on data from these States’ budget documents and U.S. Environmentally-Extended Input-Output (USEEIO) Model factors. Administration figure based on data from Florida, Minnesota, Oregon, Washington, and Texas DOT sustainability/GHG inventory reports.
10.3 Level of Effort
An agency can start by developing an inventory and baseline forecast and grow its capabilities over time to include strategy analysis and monitoring. Table 10.1 provides typical ranges of the level of effort required for each stage at the higher levels of engagement.
Table 10.1 Level of Effort Ranges for Systems-Level GHG Assessment
| Stage | Low End | High End |
| Inventory Development | A few hours for a fuels-based inventory. | 100+ hours for detailed activity-based inventory, including all modes/submodes. |
| Forecasting | A few hours to 10s of hours for simple extrapolation/trend projection. | 100+ hours for detailed activity-based modeling. |
| Target Setting | Modest effort to gain agreement among stakeholders on a policy-driven target and how it is applied. | More involved effort if it includes or follows a strategy assessment to determine the feasibility of different targets. |
| Strategy Development and Evaluation | A few 10s of hours to use effectiveness information from the literature and identify strategies consistent with other agency goals and objectives. | 100s of hours for detailed modeling of multiple strategy options. |
| Implementation | A few 10s of hours to identify GHG actions in existing plans and policies. | Potentially much greater if additional GHG-specific strategies are implemented. |
| Monitoring and Evaluation | A few hours for simple monitoring of overall GHG based on fuel sales to 10s of hours to enhance procedures using existing data (e.g., applying emission factors to State VMT estimates). | Potentially 100s of hours for detailed evaluation of implementation and outcomes of GHG-reducing activities. |
10.4 Complementarity/Consistency with Other Transportation Goals
The Moving Ahead for Progress in the 21st Century Act (MAP‑21) sets seven national Federal highway program performance goals. While GHG reduction is not explicitly referenced, it can be considered under the sixth goal: “Environmental Sustainability—To enhance the performance of the transportation system while protecting and enhancing the natural environment.”
State of Current Practice in Considering GHGs in Long-Range Planning
A 2018 survey found that
- Over half of the States surveyed did not consider GHG in their long-range transportation plan (LRTP).
- Thirteen States had considered GHG through qualitative goals or objectives in their LRTP.
- Four, including Georgia, the District of Columbia, Minnesota, and Rhode Island, had set quantitative goals, objectives, and/or reduction targets as part of their LRTP.
- A number of State DOTs, including California, Maryland, Massachusetts, Minnesota, Oregon, and Vermont, also had conducted GHG-specific strategy development and evaluation.
GHG was proposed as a national performance measure pursuant to MAP‑21, but this measure was repealed in May 2018. The measure proposed was the “percent change in tailpipe CO2 emissions on the National Highway System (NHS) compared to the calendar year 2017 level.”[1] It was to be calculated from State fuel sales or VMT estimates combined with emission factors.
State and local transportation agencies typically set their own goals for the transportation system as part of a long-range policy or systems plan. Some of these may support strategies and actions consistent with those that would achieve GHG reductions. For example
- Goals to reduce criteria pollutants and improve air quality typically result in strategies that also reduce GHG emissions by reducing travel demand, increasing travel efficiency, or introducing clean technology.[2]
- Goals to work towards sustainability often include GHG emissions and climate change mitigation as an essential aspect of sustainability.
- Goals to reduce vehicle travel should result in actions that directly reduce GHG emissions in proportion to the amount of vehicle activity.
- Goals to increase physical activity and improve community health or quality of life support GHG reduction by encouraging switching from motorized to nonmotorized travel modes.
10.5 Who—Roles and Responsibilities
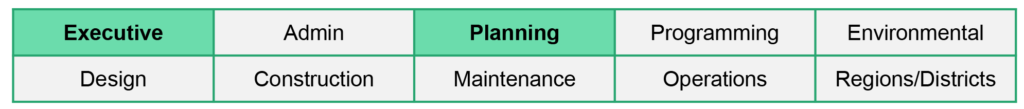
Typical roles and responsibilities for GHG assessment in systems planning are mainly housed in the Planning functional area but may include staff from other functional areas. Typical roles include the following:
- The Planning Director sets overall goals, priorities, and resource allocation for GHG assessment (consulting with executive leadership).
- The Sustainability Officer may be housed in the planning, environmental, or executive level and may lead or work with the Planning director to set direction.
- A Mid- to Senior-Level Planning or Environmental Technical Staff Person, such as the air quality lead staff, may be assigned day-to-day responsibility for implementing and coordinating activities.
- State Planning and Research (SPR), LRTP, and Programming Managers coordinate work with their work programs.
- Planners, Data Analysts, Modelers, and/or Public Outreach and Communications Staff may support the effort.
- Staff in Other Functional Areas (Design, Construction, Maintenance, Operations, and Regions/Districts) may be called on to provide data to support planning-level inventories and strategy assessment.
10.6 Inventory and Baseline Forecast Development
The first step in developing a systems-level GHG inventory is to determine which emissions are to be included. Table 10.2 provides a set of scoping considerations, including the emissions sources (e.g., direct versus fuel-cycle), modes included, timeframe of analysis, and pollutants included. Handbook for Estimating Transportation Greenhouse Gases for Integration into the Planning Process also has a discussion of scoping considerations (FHWA, 2013a, p. 16), as does A Performance-Based Approach to Addressing Greenhouse Gas Emissions through Transportation Planning (FHWA, 2013b, pp. 17–20).
Table 10.2 Scoping Considerations
| Scope Consideration | Discussion |
| Emissions Source | |
| ___ Direct emissions from vehicles | Direct calculation; should be included in all cases. |
| ___ Full fuel-cycle emissions | Includes emissions from production and transport of fuel (including electricity generation). Important if strategies using alternative fuels (e.g., biofuels, electricity, hydrogen) are to be examined. |
| ___ Construction, maintenance, and operations | May be important for capital-intensive strategies such as new construction. Planning activities may include a generalized assessment of these emissions. |
| Modes | |
| ___ Highway vehicles | Passenger cars, passenger trucks, and motorcycles; light commercial trucks, single unit trucks, combination trucks, and buses. |
| ___ Transit rail | Light rail, streetcar, heavy rail, and commuter rail. |
| ___ Intercity passenger rail | |
| ___ Air | May include only airport ground operations or also emissions from air travel originating or ending in the State. |
| ___ Freight rail and marine | May be included for comprehensive transportation sector analysis; important if strategies that involve mode-shifting from truck to rail are to be analyzed or for evaluation of port strategies. |
| Timeframe | |
| Base year: ____ Horizon/analysis year(s): _____ _____ Cumulative for period: ______ to ______ |
GHG reductions from a strategy or alternative may be compared against GHG emissions in the base year and/or baseline GHG emissions in the horizon/analysis year. Cumulative GHG emission reductions may also be of interest. |
| Pollutants or Metrics | |
| ___ Carbon dioxide (CO2) | |
| ___ Carbon dioxide equivalents (CO2e), including in addition to CO2: ___ Methane (CH4) and nitrous oxide (N2O) ___ Refrigerants | |
| ___ Energy use/fuel consumption (proxy) | |
Base-year inventory development and forecasting are discussed together because they often use the same methods. Existing resources provide step-by-step methods for developing transportation systems-level GHG inventories and forecasts. The detail is not repeated here; instead, an overview is provided with links to references for more information.
When selecting a method, the agency should consider
- Availability of data to support the method.
- Alignment of the resource needs of the method with resource constraints.
- The desired uses of the inventory and forecast. If the agency wants to use these for a detailed strategy assessment, more detail will be helpful for assessing specific strategies. If only a high-level estimate is desired, simpler methods can be used.
- Setting the stage for potential improvement of the agency’s methods in the future as tools and resources permit.
- Work being done by the State air quality or energy agency.
Table 10.3 summarizes inventory and forecast methods commonly used for State-level transportation analysis. Methods range from simple accounting based on fuel sales, to combining VMT with emission factors, to tools that combine inventory and strategy analysis capabilities.
Table 10.3 Summary of Inventory and Forecast Methods
| Method | Description | Advantages | Disadvantages | References |
| Fuel-based methods | Estimate emissions from fuel sales data. | Simplest method, data readily available for all States. | No substate geographic detail or sectoral detail (other than by fuel type) available. Requires additional assumptions to forecast. | FHWA (2013a) Parsons Brinckerhoff (2012) |
| VMT and emission factors (no travel demand model) | Estimate emissions from current and trend-projected VMT, fuel economy, and emission factors. | Can be done with modest effort in all States. | VMT forecast is likely to be a simple trend extrapolation. Will not capture speed changes. | FHWA (2013a) Strategic Highway Research Program 2 (SHRP 2) C09 Parsons Brinckerhoff (2012) |
| Travel demand model and VMT-based emission factors | Estimate emissions from current and model-forecast VMT and fuel/emission factors. | Model can account for major investments and land use changes. | Not all States have a statewide model. | FHWA (2013a) SHRP 2 C09 Parsons Brinckerhoff (2012) |
| Travel demand model and Motor Vehicle Emission Simulator (MOVES)/Emission Factor (EMFAC) | Estimate emissions from current and model-forecast VMT, speeds, and modeled emission rates. | Can account for speed changes and operational improvements; uses Environmental Protection Agency (EPA)-approved emissions model accounting for local conditions. | More resource-intensive, especially if the agency does not already have experience with MOVES or EMFAC. | FHWA (2013a) SHRP 2 C09 Parsons Brinckerhoff (2012) |
| Energy and Emissions Reduction Policy Analysis Tool (EERPAT)/VisionEval | Tool for State- and regional-level GHG inventory and strategy analysis. | Developing an inventory in this tool sets the stage for policy-level strategy evaluation. | Moderate to significant resource requirements to collect data and calibrate model. | FHWA (2013a) |
| Mode-specific data sources | May be needed for modes not included in a statewide model or VMT estimate. | Allows for more detailed inventory of specific modes, setting stage for strategy evaluation. | Resource requirements vary. | FHWA (2013a) SHRP 2 C09 |
10.7 Goal and Target Setting
Performance-based planning approaches, such as those set forth in MAP‑21, involve setting targets for key performance metrics. GHG emissions are not a Federally required performance measure, but they were included as a measure in a rule published in 2017. The measure was repealed in 2018.[3],[4] A number of States have set economy-wide GHG reduction goals that are consistent with or designed to help achieve internationally determined, science-based, worldwide reduction targets. Some States have applied targets specifically to the transportation sector.
The roles of a State DOT Planning unit in setting GHG reduction targets may include
- Providing information to support the feasibility of economy-wide and/or transportation sector targets proposed by a State executive or environmental agency.
- Setting State transportation GHG targets if required by State policy or assisting regional agencies with setting regional targets.
- Assigning targets to specific transportation subsectors to achieve an overall statewide target.
- Assigning interim targets to support attaining a long-term (e.g., 2050) target.
In the context of long-range or systems planning, a target could be set for different scopes of emissions, including:
- Emission reductions from the entire transportation sector or the entire surface transportation system.
- Emission reductions from vehicles operating on facilities under the DOT’s control (e.g., similar to the Federally proposed percent reduction in CO2 emissions on NHS roads).
- Emission reductions in the context of a specific planning document, e.g., plan versus no-plan alternative.
The first two types of targets are likely to be much more aggressive and encompass a broader range of strategies (including strategies not directly under the DOT’s control) than the last type. The emission reductions achievable through long-range plan investments are likely to be incremental compared to overall emission reductions from actions that include additional vehicle and fuel technology strategies such as regulations or pricing incentives to support electrification.
There are a variety of ways to set targets. Targets are usually expressed as a percent reduction from some base year, but they may be expressed as an absolute reduction or on a per-capita basis. A Performance-Based Approach to Addressing Greenhouse Gas Emissions through Transportation Planning provides an extensive discussion on target-setting options and methods (FHWA, 2013b).
Transportation GHG Reduction Targets in Minnesota
MN Statute 216H.02 (the Next Generation Energy Act), passed in 2007, set a goal to reduce statewide GHG emissions across all sectors, including transportation, at least 15 percent below 2005 levels by 2015, 30 percent below 2005 levels by 2025, and 80 percent below 2005 levels by 2050. The Minnesota Department of Transportation Sustainability Report: Establishing a Baseline (2016) describes Minnesota DOT’s (MnDOT’s) role in reducing GHG emissions. The report includes an inventory and forecast of Minnesota GHG emissions by transportation sources; identifies year 2025 GHG targets for the transportation sector that are based on statewide reduction targets; and compares 2015 emissions with 2025 targets (MnDOT, 2017).
The report notes that while Federal fuel economy standards will lower emissions in the future, the State was not on track to reach the 2025 GHG emissions target, and further strategies were needed. The report set preliminary 2025 targets for total transportation system emissions [29.5 million metric tons (mmt) CO2e], as well as state highway construction (2.5 mmt), operations of MnDOT facilities (21,800 mmt), and operations of MnDOT’s fleet (26,500 mmt). MnDOT conducted further assessment of GHG reduction opportunities in 2019 as part of the Pathways to Decarbonizing Transportation in Minnesota project (MnDOT, 2019), an effort that included considerable stakeholder outreach.
10.8 Strategy Identification
GHG strategy development at the systems planning level typically takes one of two forms:
- A stand-alone GHG policy/strategy study. The advantage of such a study is that strategies can be evaluated in detail for their GHG benefits, cost-effectiveness, and other benefits and implementation issues. However, to be implemented, recommendations must be incorporated into a long-range plan, capital program, or other agency work program or process.
- Inclusion of GHG reduction strategies and assessment of these strategies as part of long-range plan alternatives development and evaluation. GHG reduction is typically one of many factors considered, along with mobility, safety, preservation, etc., although some strategies [e.g., electric vehicle infrastructure investment) may be identified with the primary objective of reducing GHG.
Table 10.4 provides a list of potential GHG reduction strategies and indicates whether the State DOT would normally play a lead or supporting role in implementing these strategies. SHRP 2 Report S2-C09-RW-2: Practitioners Guide to Incorporating Greenhouse Gas Emissions into the Collaborative Decision-Making Process (SHRP 2 C09 Practitioners Guide) describes how GHG can be considered at each key decision point of the long-range plan process. Some of these strategies may be also considered as part of functional activities other than planning, such as programming, project development, and operations.
Table 10.4 Transportation Systems-Level GHG Reduction Strategies
| Strategy | Governmental Action | State DOT Role |
| Transportation System Planning and Design |
|
Lead (State highway system) Support (local planning and standards) |
| Transportation Systems Management and Operations |
|
Lead (State highway system) Support (local practices) |
| Vehicle and Fuel Policies |
|
Lead (State or State-funded fleet purchases) Support (other strategies) |
| Transportation Planning and Funding |
|
Lead (State planning and funding) Support (regional and local planning and funding) |
| Land Use Codes, Regulations, and Other Policies |
|
Support (incentives, technical assistance) |
| Taxation and Pricing |
|
Typically support, possibly lead for some direct transportation system pricing methods |
| Other Travel Demand Management and Public Education |
|
Lead (State programs) Support (regional or local programs) |
Agencies often make use of existing, published data on GHG strategy effectiveness to (1) identify strategies that are worth considering in more detail or (2) identify which existing transportation system actions should be considered GHG reduction strategies. Key references to support screening include
- The Reference Sourcebook for Reducing Greenhouse Gas Emissions from Transportation Sources (FHWA, 2012) discusses policy issues, benefits and costs, and implementation concerns for 23 demand management, systems management, and vehicle improvement strategies. The focus is on strategies that could be within the purview of a State DOT or metropolitan planning organization (MPO).
- In SHRP 2 Report S2-C09-RR-1: Incorporating Greenhouse Gas Emissions into the Collaborative Decision-Making Process (SHRP 2 C09 Report), Table 4.8 lists strategies by type and levels of application, and Tables 3.2 and 3.3 provide information on strategy effectiveness, cost-effectiveness ranges, and feasibility. This information was compiled from other studies such as Transportation’s Role in Reducing Greenhouse Gas Emissions, Volume 1: Report to Congress (U.S. DOT, 2010) and Moving Cooler: An Analysis of Transportation Strategies for Reducing Greenhouse Gas Emissions (Moving Cooler).
- Transportation’s Role in Reducing Greenhouse Gas Emissions, Volume 1: Report to Congress (U.S. DOT, 2010) provides a comprehensive assessment of the effectiveness, costs, and co-benefits of transportation strategies, for all modes, for both vehicle activity and technology, as known at the time.
- Moving Cooler: An Analysis of Transportation Strategies for Reducing Greenhouse Gas Emissions (Moving Cooler) was the first report to develop comprehensive estimates of the effectiveness and costs of nearly 50 demand-side transportation GHG reduction strategies.
- The report on the conduct of research for NCHRP Project 08-36/Task 107 (Parsons Brinckerhoff, 2012) contains about 20 pages on GHG reduction strategies (largely referencing other sources) as well as a survey of DOTs and MPOs on this topic.
- A report from the California Air Pollution Control Officers Association (CAPCOA, 2010) provides quantification of project-level mitigation of GHG emissions associated with land use, transportation, energy use, and other related project areas. It is primarily intended as a resource for local governments, but the information is relevant to State transportation agencies as well.
As of 2021, most of these sources will be close to or exceeding 10 years old. A more recent national-scale update of effectiveness and cost-effectiveness information has not been conducted, although some State and regional efforts have been undertaken. Much of the information should still be largely relevant and will not age rapidly. However, users of this older material should be cautioned about the following ways in which it may be outdated:
- Vehicle and fuel technologies have been evolving rapidly. Cost-effectiveness estimates for some technologies, especially electrification, have been changing rapidly as technology costs drop. New information also has emerged on the life-cycle GHG benefits of some alternative fuels. Current information may be found in reports from sources such as the National Renewable Energy Laboratory and the International Council on Clean Transportation.
- The GHG benefits and cost-effectiveness of travel demand reduction and systems management strategies will gradually diminish over time, as vehicles become more fuel efficient and as electric and hybrid-electric drivetrains reduce the emissions benefits of congestion relief.
- The older studies do not include information related to the benefits of emerging technologies such as shared mobility services, micromobility, and connected and automated vehicles. There are still large uncertainties regarding the effects of these innovations on travel patterns and transportation emissions (see Section 3.0).
10.9 Strategy Evaluation
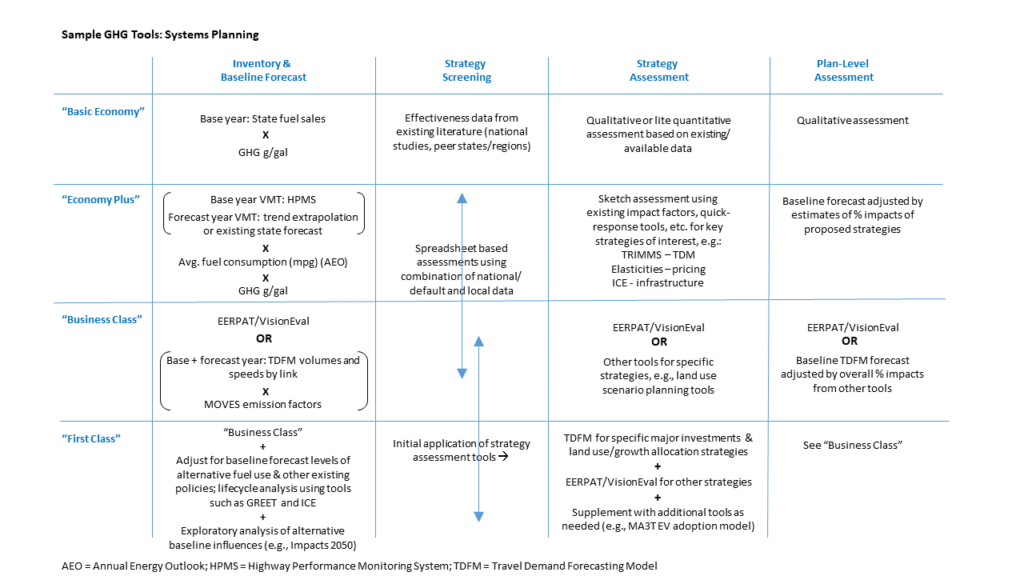
Table 10.5 provides an overview of GHG tools that could potentially support systems planning. Despite the number of tools, most of the tools have a very specific focus. In particular, there are a limited number of tools with strategy analysis capabilities. Only one robust set of tools—the VisionEval family—is designed specifically for broad-based, systems-level GHG strategy analysis. Figure 10.2 provides illustrative examples of how various tools might be applied in combination for four basic stages of GHG analysis—inventory and baseline forecast, strategy screening, strategy assessment, and plan-level assessment. This figure shows illustrative tools for four different levels of effort, ranging from the least effort (“basic economy”) to the most effort (“first class”).
Appendix B of this guide provides a more in-depth discussion of the data requirements, applications, advantages, and limitations of GHG assessment tools. Handbook for Estimating Transportation Greenhouse Gases for Integration into the Planning Process (FHWA, 2013a) includes about 10 pages on specific strategy analysis methods. Oregon DOT (2018c) provides an assessment of GHG tools from a State DOT’s perspective. Also see Section 3.4 of this guide for examples of State-specific strategy evaluations.
Table 10.5 GHG Tools to Support Systems Planning
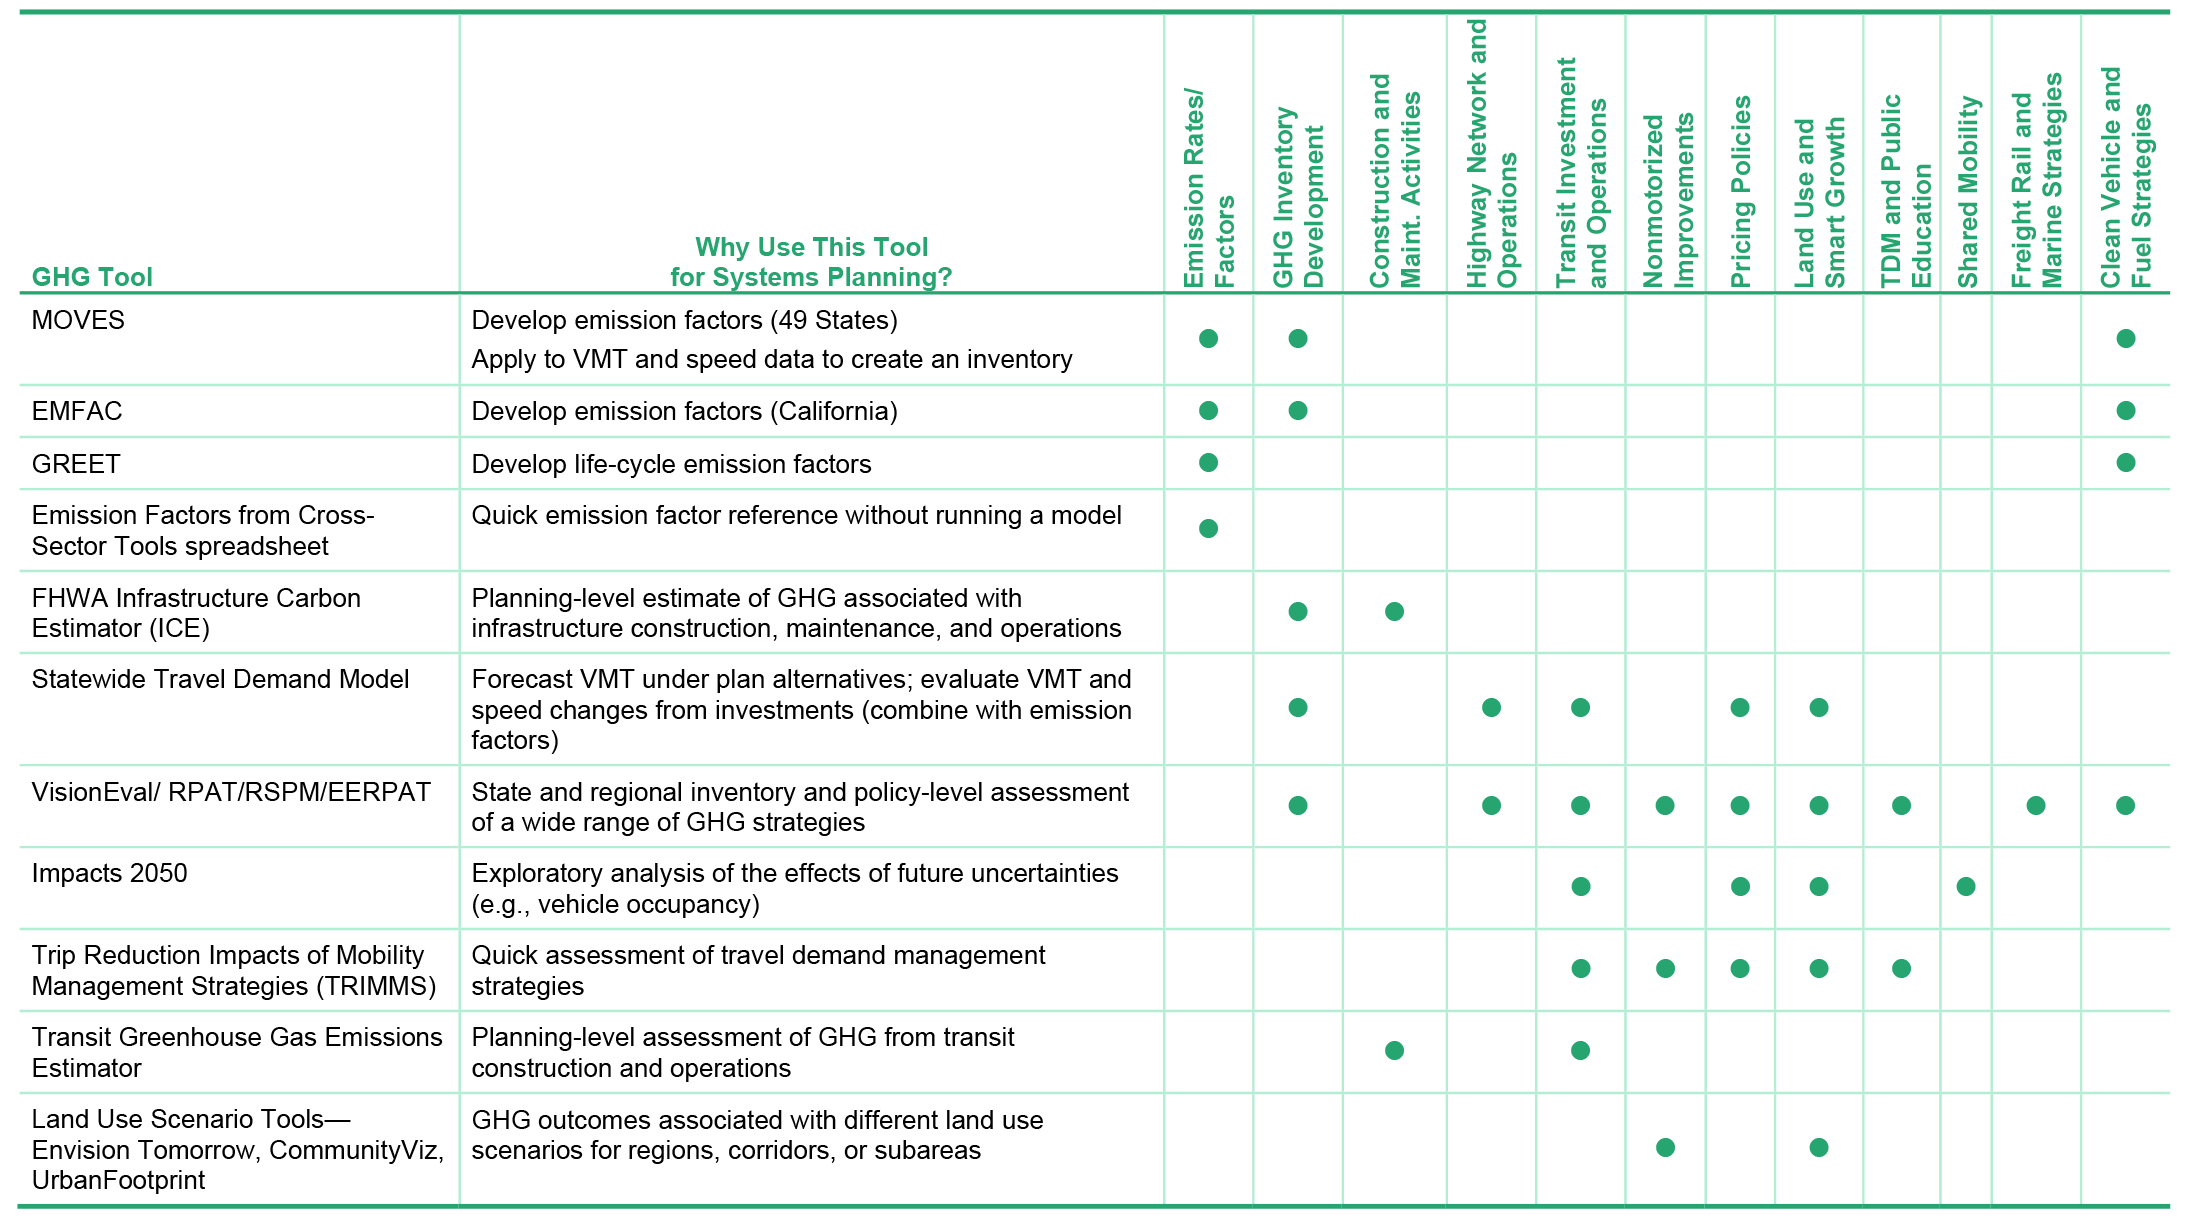
Figure 10.2 Sample Applications of GHG Tools: Systems Planning
10.9.1 Where and How to Use GHG Tools in the Planning Process
Figure 10.3 illustrates the key decision points in the long-range planning process.[5] The diagram is annotated to indicate ways in which GHG considerations may be incorporated and points at which various tools might be brought into play.
Some elements of the process may not have a tool that is fully suitable. For example, evaluation of overall long-range plan alternatives may require running the travel demand model to incorporate major projects planned under each alternative. However, there may be other strategies, such as transportation demand management (TDM) and nonmotorized improvements or efficient vehicles, that the travel demand model is not well suited to evaluate. A combination of tools and “off-model” methods (e.g., preprocessing or postprocessing using spreadsheets) is often needed to evaluate a comprehensive set of GHG strategies.
10.9.2 Evaluation of Plan Alternatives
Consideration of the overall GHG effects of a plan alternative can be done on a qualitative or quantitative basis. If qualitative, a comparison of GHG effects of the plan could be discussed regarding expected outcomes compared to the No-Action case or to GHG reduction targets that have been developed for the transportation sector or for the general economy. On a quantitative basis, unless there is a specific State requirement, the State DOT can base the comparison on what best meets the DOT’s needs. The comparison could be a rigorous pass/fail where an increase in GHG emissions would not be acceptable, or it could be a percentage comparison against a predetermined metric (such as the No-Action case, systemwide transportation GHG emissions, or an established target in a climate action plan), which would require that percentage reduction in emissions or allow that percentage increase in GHG emissions.
Figure 10.3 Key LRTP Decision Points and GHG Consideration

10.10 Implementation
Planning functions are an important first step. Implementation at this stage means giving serious consideration to GHG reduction strategies and effects within the plan, as well as the overall GHG impacts of the plan. The values of GHG reduction need to be carried through to Programming, Design, Construction, Operations, and Maintenance. Typically, implementation responsibilities transition outside of the Planning functional area and occur through capital programming of projects in a plan or additional work program elements.
10.11 Self-Assessment: Transportation Systems Planning
A self-assessment worksheet is provided to assist State DOT staff in determining where their agency falls on the GHG engagement spectrum and what additional actions their division or unit may wish to take to measure and reduce GHG emissions. This worksheet pertains to DOT units and staff with responsibilities for transportation systems planning functional areas, including strategic planning, long-range planning, modal planning, corridor planning, and subarea planning.
Click to download – Self-Assessment: 10.0 Transportation Systems Planning
[1] https://www.fhwa.dot.gov/tpm/rule.cfm.
[2] Not all air pollution control strategies reduce GHG emissions; for example, some NOx control technologies slightly increase GHG emissions.
[3] FHWA, National Performance Management Measures; Assessing Performance of the National Highway System, Freight Movement on the Interstate System, and Congestion Mitigation and Air Quality (CMAQ) Improvement Program: Final Rule, January 18, 2017, 82 FR 5971.
[4] FHWA, National Performance Management Measures; Assessing Performance of the National Highway System, Freight Movement on the Interstate System, and CMAQ Improvement Program: Final Rule, May 31, 2018, 83 FR 24920.
[5] Corresponding to the points identified in Transportation for Communities: Advancing Projects through Partnerships (TCAPP) research, a Capacity Project Brief from SHRP 2, and described in SHRP 2 Report S2-C09-RR-1: Incorporating Greenhouse Gas Emissions into the Collaborative Decision-Making Process (SHRP C09 Report). Original C09 material is found in rectangular boxes; red overlay circles and text correspond to new additions for this guide.