15.0 Maintenance
- 15.1 What Is Included?
- 15.2 Why Address GHG in Maintenance?
- 15.3 Level of Effort
- 15.4 Complementarity/Consistency with Other Transportation Goals
- 15.5 Who—Roles and Responsibilities
- 15.6 Inventory Development
- 15.7 Goal and Target Setting
- 15.8 Strategy Identification
- 15.9 Strategy Evaluation
- 15.10 Implementation
- 15.11 Monitoring, Evaluation, and Reporting
- 15.12 Self-Assessment: Maintenance
15.1 What Is Included?
This stage of greenhouse gas (GHG) assessment and mitigation addresses the day-to-day department of transportation (DOT) activities that keep the State transportation system in a state of good repair. Examples of GHG considerations in maintenance include
- Emissions from vehicles, equipment, and facilities (buildings).
- Work zone traffic delay and detours.
- Low-emission and high-recycled-content materials, including steel, asphalt, and concrete.
- Reuse and recycling of deconstructed materials.
- Application of sound asset management principles to minimize the need to replace existing facilities (with attendant GHG emissions).
15.2 Why Address GHG in Maintenance?
With the transportation system essentially “built,” much of a typical DOT’s day-to-day activities and most of its staff are devoted to maintaining the system. Maintenance activities contribute to GHG emissions directly from the trucks, equipment, facilities (buildings), and materials used to keep the system in a state of good repair. Maintenance (or lack thereof) can also influence GHG emissions indirectly through the traffic delays associated with service interruption. Highway system user emissions are orders of magnitude larger than maintenance emissions. Anything left undone in terms of maintenance that could increase user emissions by even a small percentage through traffic delay and detour is likely to overshadow any immediate gains made by reducing the delivery of effective maintenance services. Mitigation of emissions through the use of equipment, practices, and materials that reduce fuel usage is fairly straightforward, but the emissions from effects on traffic flow are both more complex and of greater importance. Reduction of emissions from the traffic detours in work zones associated with scheduled maintenance activities, such as pothole repair, paving, bridge work, mowing, etc., may be achieved through careful planning and scheduling consistent with other concerns, including safety and cost. Conversely, the traffic disruptions associated with poor pavement conditions and unscheduled “demand” maintenance due to poorly maintained highways and bridges are of major significance and—to at least a degree—avoidable through diligent asset management. GHG reduction efforts in maintenance should focus on improving maintenance efficiency through application of improved technology and planning rather than the restriction of activities that contribute to “a state of good repair.”
How Much do Rough Pavement and Work Zone Delays Affect GHG Emissions?
Under most conditions, the effect of fair to poor pavement condition on fuel economy, as compared to good pavement condition, is around 1 to 2 percent or less. However, fuel economy can be reduced by 3 to 5 percent by very poor pavement conditions, with corresponding increases in GHG emissions (Sime et al., 2020). The effect may be lessened if vehicles reduce speed because of pavement roughness.
The effects of work-zone-related traffic delays will depend on the duration of the work performed, volume of traffic affected, and resulting speed reductions or queuing. As shown in Figure 16.1, a reduction of speeds to 10 mph or less can double GHG emissions compared to operating at normal roadway speeds of 30 to 60 mph. On a 5-mile highway segment where a work zone creates a queue ½ mile long, GHG emissions would be increased about 10 percent for the affected traffic. For a work zone operating at all hours of the day for 1 month, the annual GHG increase on that highway segment would be just under 1 percent compared to work zone scheduling that avoided creating additional congestion.15.3 Level of Effort
Improvement of maintenance management through improved information technology means the effort needed to assess GHG emissions from maintenance activities should be something less than a few hundred hours. This effort would involve inventorying fuel and material usage and translating this to GHG emission rates, as well as considering emissions reduction strategies in maintenance program planning. That said, the development and implementation of emissions reductions can involve significant effort and involve changes to operational norms, depending upon the desired results. Generally speaking, GHG reductions of a few to several percent can be achieved and monitored in concert with related efforts to reduce fuel usage and update material specifications. Additional measures, driven mainly by the need to reduce GHG emissions, would require an escalating degree of effort.
15.4 Complementarity/Consistency with Other Transportation Goals
GHG reduction strategies for maintenance can be consistent with other goals with little if any additional effort. These strategies include
- Facilitation of traffic flow.
- Reduction of fuel and energy consumption from vehicles, equipment, and facilities.
- Reductions in criteria pollutants and air toxics.
- Operational efficiencies through use of updated maintenance management systems, asset management, life-cycle planning, etc.
The Federal Highway Administration (FHWA) defines asset management as “a strategic and systematic process of operating, maintaining, and improving physical assets, with a focus on both engineering and economic analysis based upon quality information, to identify a structured sequence of maintenance, preservation, repair, rehabilitation, and replacement actions that will achieve and sustain a desired state of good repair over the life cycle of the assets at minimum practicable cost” (23 CFR 515.5). Sound asset management practices can support life-cycle GHG reduction, in addition to other goals such as good pavement conditions and cost minimization, by applying maintenance and preservation activities that minimize the long-term need for more GHG-intensive reconstruction.
15.5 Who—Roles and Responsibilities
Responsibilities by role for GHG reduction as they relate to this functional area include the following:
- Executives—Send a clear signal that GHGs are to be considered and should shape projects and activities as one of many considerations. The degree of weight ascribed to GHG reduction compared to other considerations will likely be a function of the State’s and the DOT’s priorities. Encourage a life-cycle approach to costs and benefits. Support budget initiatives as needed to reduce emissions.
- Administration/Purchasing—As appropriate, support efforts at maintenance facilities to reduce GHG emissions through the use of renewable energy technologies and recycled materials.
- Environmental—Provide technical support for the evaluation of maintenance-related GHG reduction strategies. Educate staff on the need to reduce GHG emissions.
- Design/Specification Writer—Support maintenance staff efforts to employ GHG-emission-reducing materials consistent with their needs. This may involve the use of recycled materials and fly ash to replace concrete as practicable. Develop designs that minimize the need for ongoing maintenance.
- Construction—Deliver projects that minimize the need for ongoing maintenance.
- Regions/Districts—Support maintenance staff efforts to reduce GHG emissions and provide feedback on the practicality and efficacy of reduction initiatives.
15.6 Inventory Development
Modern highway maintenance management systems as described in the American Association of State Highway and Transportation Officials (AASHTO) Maintenance Manual (AASHTO, 2007) allow DOTs to track and optimize their efforts and expenditures across a range of factors, including labor, materials, equipment, and fuel. Direct estimation of GHG emissions from summary fuel and materials usage data is a comparatively simple matter. For example:
Emissions (fuels) = gallons (of fuel) x emission factor (g/gal)
Emissions (materials) = tons (of material) x emission factor (g/ton)
Section 15.9 provides information on data sources for appropriate fuel and materials emission factors. Additional resources may be found in Appendix B.
15.7 Goal and Target Setting
Goals or targets can be set for reducing emissions in maintenance activities, on a percentage basis, compared to standard practice. Targets are most effectively set and applied on a programmatic basis (i.e., for the maintenance program as a whole).
15.8 Strategy Identification
Strategies for tracking and reducing GHG for specific maintenance activities are shown in Table 15.1.
Table 15.1 Strategies for Reducing GHG from Highway Maintenance Activities
| Maintenance Activity | Emission Source | Potential Mitigation Methods | ||||
| Equipment | Materials | Alt Fuels | Low Emission Equipment1 | Recycled Materials | Operational Efficiencies | |
| Traveled Way | ||||||
| Sweep and vacuum roads and bridges | • | • | ||||
| Maintain pavement markings | • | • | • | |||
| Patch deteriorated pavements | • | • | • | • | ||
| Seal cracks and joints | • | • | ||||
| Resurface pavements | • | • | • | • | • | |
| Control snow and ice | • | • | • | |||
| Shoulders | ||||||
| Clean shoulders | • | • | ||||
| Repair/replace shoulder pavements | • | • | • | • | ||
| Reseed and mulch grass shoulders | • | • | • | |||
| Roadsides | ||||||
| Restore erosion controls | • | • | • | • | • | • |
| Maintain vegetation | • | • | • | |||
| Maintain guiderail | • | • | • | • | • | |
| Drainage | ||||||
| Maintain facilities | • | • | • | • | • | • |
| Improve facilities | • | • | • | • | • | • |
| Structures | ||||||
| Maintain deck surfaces | • | • | • | • | • | • |
| Repair substructures | • | • | • | • | • | • |
| Protect watercourses and embankments | • | • | • | • | • | • |
| Clean bridge bearings | • | • | • | |||
| Wash bridges | • | • | • | |||
| Paint bridges | • | • | • | • | ||
| Culverts | ||||||
| Clean culverts | • | • | • | • | ||
| Replace culverts | • | • | • | • | • | |
| Rest Areas | ||||||
| Heat, lights, and AC | • | • | • | • | ||
| Cleaning and maintenance | • | • | • | • | ||
Source: Adapted from NCHRP Project 25-25/Task 73.
1 “Low Emission Equipment” refers to electrically powered equipment. The applications for which electric equipment are available are increasing and may support additional categories in this column.
Figure 15.1 shows mitigation potential from construction- and maintenance-related activities for a hypothetical State. While maintenance makes a smaller contribution than construction, some savings can be achieved through the use of renewable diesel in the maintenance fleet. However, this assessment only considers potential savings from fuel switching and does not include relatively modest savings from other strategies, such as alternative maintenance schedules and space heating at facilities. States with less or more new construction in their program may show a different ratio of construction to maintenance emissions and mitigation potential. More importantly, Figure 15.1 does not include avoidance of the system user emissions that can be caused by a poor state of system repair.
Figure 15.1 Example of Detailed Evaluation of Mitigation Potential for Construction, Maintenance, and Operations
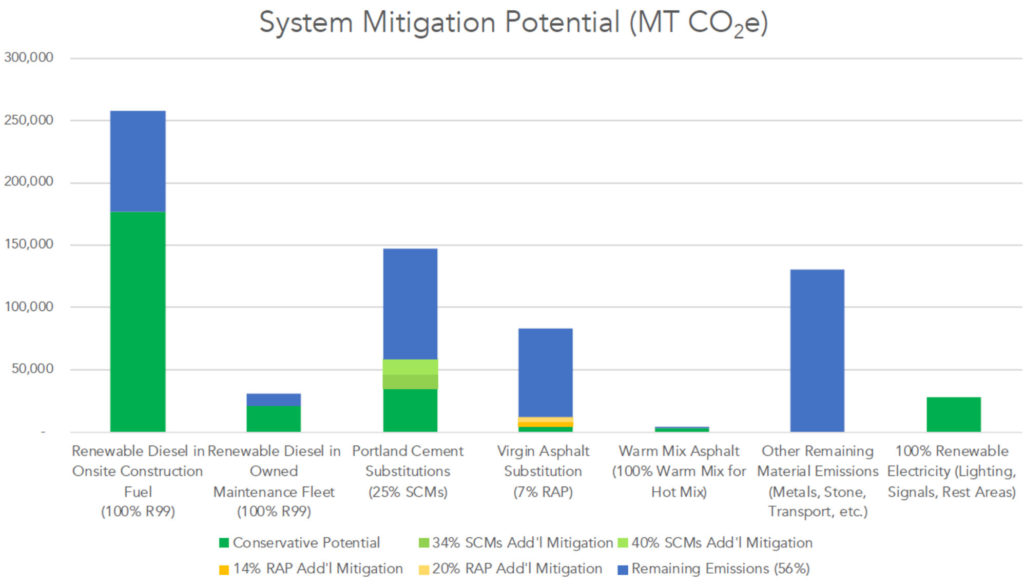
Figure 15.1 shows the mitigation potential of different GHG-reducing actions compared to a blended average of existing DOTs’ system footprints for the operation, maintenance, and construction of the physical infrastructure. The green and yellow bars show the portion of the emission source that can be mitigated with common interventions. For Portland cement substitutions, the figure shows the substitution of supplemental cementitious materials (SCMs) for the range of substitution amounts used throughout the country. Local weather and market conditions often determine the percentage of use of SCMs. For asphalt, the figure shows a similar range of reground asphalt or recycled asphalt pavement (RAP) and the potential of low, medium, and high RAP content scenarios. The standalone blue bar represents the balance of all other non-pavement materials.
15.9 Strategy Evaluation
Table 15.2 presents a list of evaluation tools and data sources for assessment of direct GHG reductions from alternative maintenance practices and materials. Additional information on these tools may be found in Appendix B. Evaluation of GHG mitigation measures in maintenance should benefit from the programmatic nature of maintenance activities and the “Plan, Do, Check, Act” methods typically employed in their evaluation.
Table 15.2 Evaluation Tools and Data Sources for Maintenance GHG Reduction Strategies
| Data Source/Tool | Material Factor | Fuel Factors | Calculation Platform | Uses for Maintenance Emissions Calculations |
| FHWA Infrastructure Carbon Estimator (ICE) | • | • | • | Construction carbon calculator |
| ICF International and Marie Venner (2010) | • | • | • | Assessment tool and cost estimator |
| Pavement Life-Cycle Assessment Tool (PaLATE) | • | • | Life-cycle cost and environmental impacts calculator | |
| Good Company Construction Carbon Calculator G4C | • | • | • | Designed for heavy construction and pavements |
| United States Forest Service 1605b Forestry Tables | • | Methods for calculating forest ecosystem and harvested carbon, with standard estimates for forest types of the United States |
15.10 Implementation
Unlike “one off” capital projects, maintenance activities are typically operated as a program with one overall budget on an annual cycle. With the organization trained, equipped, managed, and funded accordingly, direct reductions in GHG emission may be incrementally accomplished using the standard management approach of piloting and adaptation through experience for maximum efficiency.
With the inclusion of GHG reduction as a programmatic goal, implementation of GHG reduction practices should follow the standard “Plan, Do, Check, Act (Improve)” cycle employed by most DOT functional units, as shown in Table 15.3.
Table 15.3 GHG Management Cycle: Maintenance
| Plan | Set policy | Establish targets | Make assignments |
| Do | Develop procedures | Train staff | Implement |
| Check | Report | Consolidate reports | Evaluate performance |
| Act (Improve) | Check in agencywide | Explore alternatives | Revise procedures |
Source: Adapted from Using an Environmental Management System to Meet Transportation Challenges and Opportunities: An Implementation Guide (AASHTO, 2003) and Beyond the Short-Term—Transportation Asset Management for Long-Term Sustainability, Accountability and Performance (FHWA, 2010b).
15.11 Monitoring, Evaluation, and Reporting
As a programmatic function, maintenance relies on monitoring, evaluation, and reporting as essential components of the “Plan, Do, Check, Act (Improve)” cycle. In this context, reduction in GHG emissions is “just another” objective to be factored into this operational cycle using the same precepts and communication channels that have proven effective in achieving improved life-cycle efficiencies, reduced traffic congestion, worker safety, environmental compliance, etc.
15.12 Self-Assessment: Maintenance
A self-assessment worksheet is provided to assist State DOT maintenance staff in determining where their organization falls on the GHG engagement spectrum and in identifying additional activities to estimate and reduce GHG emissions related to maintenance.
Click to download – Self-Assessment: 15.0 Maintenance