16.0 Transportation Systems Management and Operations
- 16.1 What Is Included?
- 16.2 Why Address GHG in TSM&O?
- 16.3 Level of Effort
- 16.4 Complementarity/Consistency with Other Transportation Goals
- 16.5 Who—Roles and Responsibilities
- 16.6 Inventory Development
- 16.7 Goal and Target Setting
- 16.8 Strategy Identification
- 16.9 Strategy Evaluation
- 16.10 Implementation
- 16.11 Monitoring, Evaluation, and Reporting
- 16.12 Self-Assessment: Transportation Systems Management and Operations
16.1 What Is Included?
This section discusses how greenhouse gas (GHG) emissions from the transportation system can be addressed through a State department of transportation’s (DOT’s) transportation systems management and operations (TSM&O) activities. According to the American Association of State Highway and Transportation Officials’ (AASHTO’s) The Transportation Systems Management and Operations (TSM&O) Guidance, TSM&O is a set of strategies to anticipate and manage traffic congestion and minimize the other unpredictable causes of service disruption and delay, thereby maintaining roadway capacity while improving reliability and safety (AASHTO, 2014). Strategies combine intelligent transportation system (ITS) information and control communications infrastructure with related field procedures and protocols within a specific operational concept. This operational concept is designed to anticipate and mitigate the impacts of the various causes of congestion, both recurring and nonrecurring.
16.2 Why Address GHG in TSM&O?
TSM&O activities are one of the most effective strategies under the DOT’s direct control for reducing emissions. GHG system emissions are basically a function of vehicle miles traveled (VMT), vehicle mix, and speed and acceleration profiles. Internal combustion engine vehicles operate most efficiently while traveling at relatively constant speeds within a moderate speed range. Low-speed travel, frequent acceleration, and idling—typical characteristics of congested conditions—increase fuel consumption and GHG emissions. Operation at very high speeds also increases emissions. Figure 16.1 gives an illustrative profile of the relationship between travel speeds and GHG emissions and the role of traffic operations strategies in reducing emissions.
Figure 16.1 Speeds versus Emissions
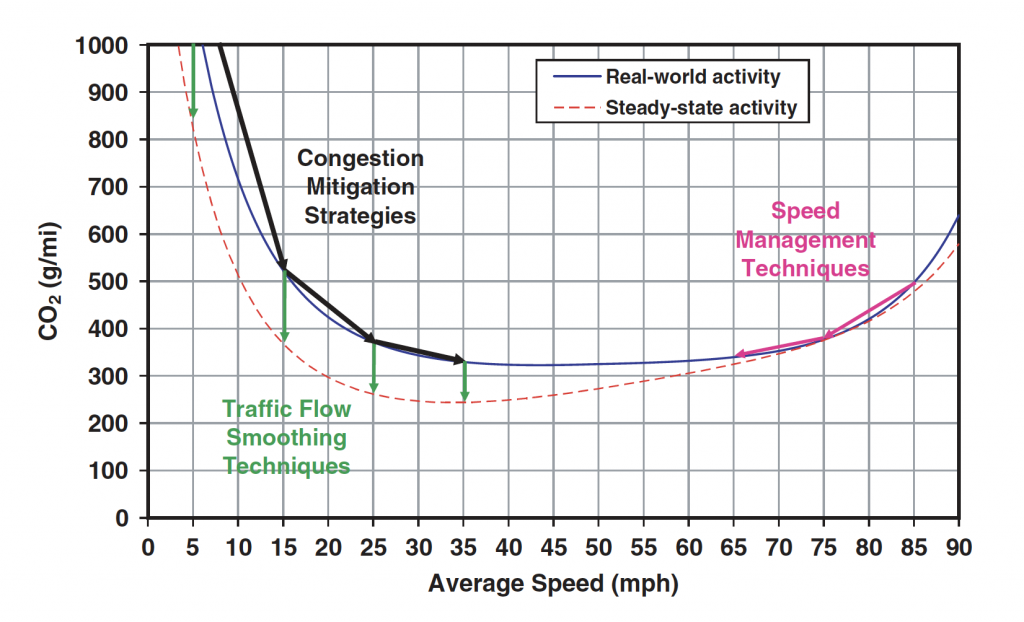
Reducing congestion through TSM&O can reduce emissions without requiring travelers to change their behavior or purchase different types of vehicles. Traffic flow improvements that reduce emissions also typically benefit travelers in other ways—time and reliability savings and possible safety benefits from reduced stop-and-go traffic. These strategies can be a “win-win” for mobility, the economy, and the environment.
While TSM&O strategies generally reduce emissions in the short term, there may be some longer-term offsetting effects if travel time savings lead to “induced demand” that increases overall travel. Methods of accounting for induced demand are discussed in Section 14.9.
16.3 Level of Effort
A State DOT already typically has a variety of TSM&O responsibilities, such as
- Developing a congestion management plan or process or working with metropolitan planning organizations (MPOs) on their plans.
- Retiming traffic signals.
- Operating incident management programs.
- Planning and deploying ITS infrastructure such as real-time traffic information signs and broadcasts, adaptive signal control, ramp metering, and integrated corridor management systems.
- Operating traffic management centers to actively manage traffic conditions.
- Operating managed lanes.
- Managing work zones, special events, and severe weather response.
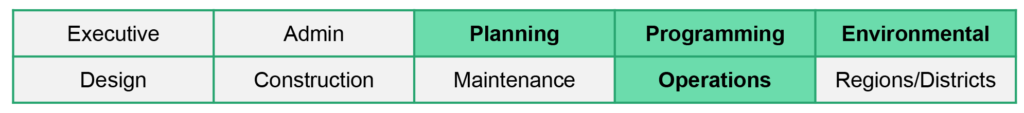
Considering GHG emissions in TSM&O may cover a spectrum, from simply measuring the benefits of what already is being done to optimizing current operations for GHG emission reduction to expanding TSM&O activities with a focus on emissions as well as congestion reductions (Figure 16.2).
Figure 16.2 Strategies of GHG Consideration in TSM&O

The level of effort can range from modest (a few tens or hundreds of staff hours to estimate current reductions with sketch methods such as speed-based emission factors) to substantial (involving the investment of a significant fraction of capital and operating funds for the deployment of new operations strategies to reduce emissions).
Example—DOT Activities to Reduce GHG Through TSM&O
In 2013, Caltrans published the report Caltrans Activities to Address Climate Change (Caltrans, 2013). This report includes a section describing maintenance and operations initiatives for GHG reduction. The report cites Caltrans’ recently deployed traffic management strategies with the potential to further smooth traffic and reduce GHG emissions, including
- High-occupancy vehicle and high-occupancy toll lanes, working in partnership with local and regional transportation agencies.
- Ramp metering, working with local and regional partners, which has resulted in a 30–40 percent reduction in freeway congestion in peak hours.
- Traffic light synchronization funded under the Proposition 1B Traffic Light Synchronization Program, which has achieved 45-percent reductions in travel time delays along the corridors where these projects are in place.
- A Traffic Management Systems Master Plan, Ramp Metering Development Plan, and Connected Corridors pilot project.
- Changes in work zone management to minimize overall delay from work zones, such as concentrating projects in a brief period during which facilities are closed completely and communicating closures and options to travelers.
- Freeway Service Patrols to clear incidents.
- Solar- and wind-powered ramp signals, radio repeaters, and traffic counting devices.
The report also suggests additional activities, including
- Maximizing the benefits of ramp metering through cooperation with local agencies and joint operation of freeway ramps and local streets.
- Tracking the traffic and GHG impacts of total roadway closures for maintenance and rehabilitation.
- Improving the communication of the results of research and innovation projects.
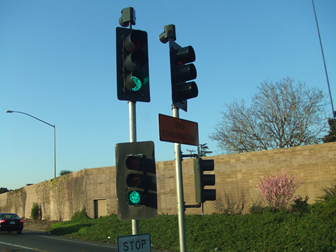
Freeway ramp traffic control device in California.
16.4 Complementarity/Consistency with Other Transportation Goals
Strategies to reduce congestion can have substantial safety and mobility benefits for travelers. These strategies can also have economic benefits by improving general mobility, workforce accessibility, and regional attractiveness and reducing congestion for freight and other commercial vehicle travel. Operational strategies that reduce GHG emissions will also typically reduce emissions of criteria pollutants and other pollutants of concern, thereby improving overall air quality and human health. Projects funded by the Federal Congestion Mitigation and Air Quality (CMAQ) Improvement Program that are focused on traffic operations will usually have GHG as well as air quality benefits.
16.5 Who—Roles and Responsibilities
A State DOT typically has responsibility for TSM&O strategies on Interstate and State highways and may support local jurisdictions or traffic management organizations in implementing TSM&O on local roads. Internal roles typically include:
- TSM&O operations within a DOT are usually directed from a central “Traffic Engineering” and/or “Safety” Division within the Operations, Maintenance, or Engineering unit. Central office functions typically involve technical direction and support on ITS, traffic operations, management, information, and safety. This office also acts as a policy liaison with external traffic police organizations and coordinates internally with agency departments such as Planning, Budgeting, and Engineering. Day-to-day operational matters are sometimes managed through regional traffic management centers, but most often these matters are managed through the local Regions/Districts.
- Staff of the Environmental unit would typically support TSM&O staff in liaison with environmental agencies, estimating emissions by providing emission factors or performing emissions calculations based on data collected through TSM&O systems.
- Staff of the Planning and Programming units may also be involved in evaluating and prioritizing TSM&O strategies as part of long-range planning, budgeting, programming, and project development—which may include consideration of the GHG benefits of these strategies. See Statewide Opportunities For Linking Planning and Operations: A Primer for more information on linking planning and operations (FHWA, 2008).
External partners can also be key stakeholders in implementing TSM&O strategies. Effective operation of the transportation system typically requires coordination among multiple entities, including the State DOT; county and municipal transportation departments; and other facility operators such as toll road authorities, transit operators, and law enforcement and emergency response agencies. A task force or working group may exist to coordinate these agencies’ activities and optimize operations for the transportation system as a whole. GHG reduction objectives, strategies, considerations, and reporting may be coordinated through this group.
16.6 Inventory Development
Total emissions from highway vehicles can be estimated in an inventory using various methods that are described in Section 9.0. The tools and methods used for highway emissions inventories may account for the emission reductions provided by existing TSM&O strategies, through the calibration of overall fuel consumption or emissions to observed conditions. However, these systems-level tools and methods typically do not provide the detail needed to evaluate the effects of specific operational strategies. Operations-specific evaluation methods as described below may be needed. Emission rates, as well as the response of emissions to traffic operations strategies, will vary across vehicle types. At a minimum, different GHG emission rates should be considered for up to six vehicle classes consistent with those for which traffic classification counts are reported to FHWA for the Highway Performance Monitoring System (HPMS), as shown in Column 1 of Table 16.1. More detailed evaluation of emissions may consider additional vehicle classes, such as the 13 source types defined in the Motor Vehicle Emission Simulator (MOVES) 2014 model, which nest within the HPMS vehicle types.
Table 16.1 Vehicle Types for Emissions Analysis
| HPMS Vehicle Type | MOVES Source Type |
| Motorcycle | Motorcycle |
| Passenger Car | Passenger Car |
| Other Four-Tire, Two-Axle | Passenger Truck |
| Light Commercial Truck | |
| Buses | Intercity Bus |
| Transit Bus | |
| School Bus | |
| Single Unit Trucks | Refuse Truck |
| Single Unit Short-Haul Truck | |
| Single Unit Long-Haul Truck | |
| Motor Home | |
| Combination Trucks | Combination Short-Haul Truck |
| Combination Long-Haul Truck |
For strategies that may encourage mode shift, such as multimodal traveler information and bus priority treatments, the GHG impacts of mode shifting should be considered in addition to any effects of traffic flow changes.
Some TSM&O strategies may result in a very modest increase in emissions to implement the strategy itself. Examples could include the power consumed in operating a traffic management center or the fuel consumed by incident response vehicles. However, these effects are typically small compared to emissions from transportation system users as a whole and will be outweighed by the savings in GHG emissions from the operation of the facility. Emissions from facilities and vehicles to implement TSM&O strategies can be considered using the data sources and methods described in Section 9.9.
16.7 Goal and Target Setting
When tracking overall emissions from transportation system users, it can be difficult to isolate the overall emissions changes attributable to TSM&O strategies from the effects of other changes that occur in transportation conditions, such as overall travel demand, shifts in demand by location and time of day, and improvements to the efficiency of vehicles. It may be more productive to focus target setting within the TSM&O functional area on incremental improvements for which reductions can be measured. An example would be achieving a GHG reduction of X metric tons per year through implementation of CMAQ-funded projects and/or other TSM&O projects for which GHG benefits can be estimated. However, it will be important to place this estimated contribution in the context of agencywide or statewide targets for transportation system GHG reduction.
How Much Can TSM&O Strategies Reduce GHG Emissions?
Different studies have estimated varying reduction potentials from TSM&O strategies. For example, a Report to Congress (U.S. DOT, 2010) concluded that traffic management, including signal coordination, ramp metering, and incident response, could reduce surface transportation GHG emissions by up to 0.5 percent, with real-time traffic information and truck idle reduction adding incrementally to this. In contrast, an Oregon DOT analysis (as cited in Section 3.4) estimated that all ITS strategies could reduce emissions by over 20 percent. The differences among studies appear to result from what is included (e.g., in some studies, strategies such as automated vehicles or lower speed limits are included), how induced demand is considered, the level of aggressiveness of the strategies, and assumptions about baseline deployment levels.
16.8 Strategy Identification
The AASHTO TSM&O guide (AASHTO, 2014) provides examples of best-practice TSM&O strategies along with their general effectiveness for improving energy and the environment, as shown in Table 16.2.
Table 16.2 TSM&O Strategies and Environmental Effectiveness
| TSM&O Strategies | Relative Effectiveness |
| Traffic Incident Management | High |
| Safety Service Patrols | High |
| Traffic Signal Optimization/Retiming | High |
| Traffic Adaptive Signal Control | High |
| Electronic Toll Systems | High |
| Electric and Alternative Fuel Vehicle Recharging/Refueling Stations | High |
| Traveler Information and Incentive Apps | High |
| Incident Surveillance/Detection | Medium |
| Road Weather Information Systems | Medium |
| Work Zone Management Systems | Medium |
| Ramp Metering Systems | Medium |
| Electronic Border Crossing Systems | Medium |
| Commercial Vehicle Information Systems | Medium |
| Bus Rapid Transit | Medium |
| Transit Signal Priority | Medium |
| Transit Automated Vehicle Locator/Computer-Aided Dispatch | Medium |
| Managed Lanes (including clean vehicle incentives) | Medium |
| Traveler Information/Dynamic Message Signs | Low |
| Parking Management Systems (esp. to encourage transit usage) | Low |
| Curb Management | Low |
Source: Adapted from Investment Opportunities for Managing Transportation Performance through Technology (U.S. DOT, 2009) as reprinted in The Transportation Systems Management and Operations (TSM&O) Guidance (AASHTO, 2014), with some additions and minor modifications.
The Active Transportation and Demand Management Implementation and Operations Guide (FHWA, 2017) provides information on the use of available tools and assets to manage both traffic flow and demand. Examples include adaptive traffic signal control, dynamic lane use control, and dynamic speed limits.
16.9 Strategy Evaluation
Table 16.3 provides an overview of tools and methods that currently are available to support emissions estimation for TSM&O strategies. It is important to consider that the emissions reduction estimates for these strategies will only be as good as the information available on changes in traffic operations. For ex ante project evaluation, major projects sometimes have microsimulation model data available that can be used to estimate emissions changes. Smaller projects will rarely have such information available, and sketch-level estimates may be required based on estimated changes in project speeds or observed changes for similar projects.
For projects that are not expected to affect traffic volumes or cause mode shifts, a simple calculation can be performed:
Δ Emissions = Annual average daily traffic (AADT) * Segment Length * (EFspeed2−EFspeed1)
Where Δ Emissions is summed across vehicle types and time periods (e.g., peak and off-peak, which may have different speeds), and EF is the emission factor (grams per vehicle-mile) at speed x for a given vehicle type. Air quality or environmental staff may be able to provide a table of emission factors by speed and vehicle type to assist in this calculation.
For strategies that encourage mode shift from auto to transit without adding transit service (e.g., due to faster transit operations or better information), a basic equation such as the following may be used to estimate the GHG effects of mode shifts:
Δ Emissions = New Transit Riders * Prior Drive Mode Share * Average Trip Length * EFauto
Where Prior Drive Mode Share is the fraction of new riders who would have driven a car (or ridden as the primary occupant of a taxi or ride-hailing vehicle). New Transit Riders could be estimated through observed data (ex post evaluation), ridership elasticities (percent change in ridership with respect to percent change in travel time), or with a model that predicts mode shift.
Induced Demand and its Consideration in TSM&O Strategy Evaluation
Induced (or latent) demand is, in general, a phenomenon in which as the supply of a good increases, more of the good is consumed. In the context of transportation, induced demand is considered to mean the increase in travel that occurs as a result of improvement in transportation system performance (e.g., reduction in travel time) or capacity. For example, the idea is that if travel is made quicker and easier, people will travel more. The GHG effects of additional travel may, at least to some extent, offset the GHG reduction benefits from smoother traffic flow.
The magnitude of induced demand can be difficult to predict, and it will vary depending upon the specific context of a project and the evaluation timeframe, with more induced demand occurring over a long time horizon. However, some recent studies have attempted to compare the GHG impacts of induced travel against the benefits of operational strategies.
The Moving Cooler study (Moving Cooler) performed national-scale evaluations of the GHG benefits and cost effectiveness of a wide range of transportation strategies, including operations strategies, using the FHWA Highway Economic Requirements System (HERS) model Operations Preprocessor and the ITS Deployment Analysis System. The modeling systems accounted for induced demand at an aggregate scale and considered different levels of deployment and effectiveness in different metro area sizes and structures. Induced demand reduced, but did not entirely negate, the GHG benefits of operations strategies. ITS strategies still ranked as moderately cost-effective compared to other strategies evaluated, in the range of about $50 to $500 per ton of GHG reduced over the 2020–2050 timeframe, depending upon the specific strategy.
FHWA (2014) used advanced modeling techniques to overcome past technical limitations in considering the effects of highway operations strategies on induced demand. Findings include:
- The effect of improved signal timing in a corridor was used to replicate the effect of arterial operations strategies (e.g., traffic adaptive control systems). Travel time performance was worsened by the induced demand but was still better than the baseline conditions.
- In an Atlanta case study, in locations where the operational strategies such as ramp metering did improve travel times, no discernible increase in VMT occurred.
- Integrated travel and land use modeling in the San Francisco Bay Area found that the deployment of operations strategies increases regional VMT, and the increase was proportional to the travel time savings. For the network that was tested, which was significantly congested, for strategies that represent a reasonably high impact on congestion (e.g., bundles of strategies) the VMT increase does not fully erode the CO2 emissions benefits of operations; small benefits remain after accounting for both short-term and long-term demand effects at the regional level. Strategies that have a lower congestion impact (e.g., ramp metering deployed alone), a marginal increase in CO2 emissions was found.
- Adjusting a freeway corridor microsimulation model to account for long-term demand increases showed that the increased demand runs showed less benefit than the original runs, but for the majority of cases, there was a small net reduction in emissions relative to the base case.
Cambridge Systematics, Inc., and Oregon Systems Analytics (2016) applied the FHWA Energy and Emissions Reduction Policy Analysis Tool (EERPAT) to evaluate GHG reduction strategies in Massachusetts, including ITS strategies. In this instance, a small increase in GHG emissions was estimated, as the induced demand impacts outweighed the traffic flow benefits.
Induced demand effects are complex and can be challenging to model. At a minimum, the analyst should be aware of whether the particular analysis tool being used accounts for induced demand effects and, if so, how. In situations where induced demand is likely to increase GHG emissions, it may be desirable to consider mitigation strategies such as pricing or improved travel alternatives.
Additional resources on considering induced demand in analysis include:
- FHWA, “Induced Travel: Frequently Asked Questions” (website). https://www.fhwa.dot.gov/planning/itfaq.cfm.
- NCHRP Report 765: Analytical Travel Forecasting Approaches for Project-Level Planning and Design (CDM Smith et al., 2014).
- The U.S. Enivronmental Protection Agency’s (U.S. EPA’s) Guidebook on Induced Travel Demand (Jack Faucett Associates, 2002).
Another source of information on TSM&O emissions effectiveness is the ITS Benefits Database, which documents findings from ITS deployment evaluations on the effect of ITS on transportation systems performance and provides convenient access to typical benefits of ITS deployments.
Table 16.3 Evaluation Tools and Methods for TSM&O GHG Reduction Strategies
| Method or Tool | Uses for TSM&O Strategy Evaluation |
| FHWA CMAQ Emissions Calculator Toolkit and California Air Resources Board (CARB) SB1 Grant Program Emissions Calculator | Sketch tools to estimate emissions benefits of projects funded using CMAQ or other air quality improvement funds. Tools include traffic flow improvement projects, based on changes in traffic speeds and volumes by vehicle type. FHWA tools provide somewhat more functionality than CARB tools. |
| GreenDOT | Spreadsheet tool that includes a module for traffic smoothing strategies. |
| U.S. EPA MOVES | EPA-approved emission factor model for use in 49 States. May be run in project mode using average speed, drive cycles, or operating mode distribution inputs to estimate changes in emissions as a result of changes in traffic flow conditions. (Speed changes need to be estimated through another method such as field observations or volume-delay formulas.) |
| CARB EMFAC model | CARB-approved EMFAC model for use in California. Functionally similar to MOVES. |
| Volume-delay functions | Establishes a relationship between volume, capacity, and vehicle speed; can be used as a sketch-level estimation of speed changes from capacity increases (or equivalent operational effects)1 to apply to speed-based emission factors. |
| Microsimulation model emissions output | Detailed modeling of traffic flow conditions based on roadway geometry, traffic control operations, and vehicle mix. May be conducted to evaluate major capacity or operations project alternatives. Some microsimulation models may provide emissions or fuel consumption as a direct output. |
| VisionEval/EERPAT | Planning-level model that considers deployment of a variety of traffic operations strategies (freeway and arterial management, ramp metering, incident management). Intended for regional, not project-specific, analysis. Accounts for effects of vehicle technologies and induced demand. |
1 There are some methods for translating operations improvements into equivalent capacity increases built into the FHWA HERS model. See the HERS documentation published by FHWA.
16.10 Implementation
GHG-reducing TSM&O strategies would normally be implemented as part of an agency’s day-to-day TSM&O responsibilities. Additional activities may be added to estimate GHG emissions reductions and consider these impacts in strategy prioritization and design. In addition, GHG-focused strategies may be added to an agency’s TSM&O work program, for example, implementing bus priority treatments at intersections.
16.11 Monitoring, Evaluation, and Reporting
Transportation agencies are increasingly moving towards incorporating performance measurement into all facets of their operations. The AASHTO TSM&O guide provides guidance for moving through the various TSM&O capability maturity levels (1 through 4) on performance measurement (AASHTO, 2014). GHG emissions can be incorporated as part of the agency’s TSM&O performance measurement activities consistent with the usual “Plan, Do, Check, Act” approach illustrated in Table 16.4.
Table 16.4 GHG Management Cycle: TSM&O
| Plan | Set policy | Establish targets | Make assignments |
| Do | Develop procedures | Train staff | Implement |
| Check | Report | Consolidate reports | Evaluate performance |
| Act (Improve) | Check in agencywide | Explore alternatives | Revise procedures |
Source: Adapted from Using an Environmental Management System to Meet Transportation Challenges and Opportunities: An Implementation Guide (AASHTO, 2003) and Beyond the Short-Term—Transportation Asset Management for Long-Term Sustainability, Accountability and Performance (FHWA, 2010b).
GHG-reducing activities and outcomes from TSM&O projects and programs can also be reported back to Central Administration, Planning, Environmental, or other units charged with overall reporting of GHG reduction activities and benefits across the agency. These may include process-based measures (e.g., consideration of GHG in strategy evaluation), output-based measures (e.g., number of signals retimed), and outcome-based measures (actual emissions reduced or emissions per dollar). These in turn may be used to plan future investments for GHG offsets along with possible mobility and safety improvements.
Since it is difficult to directly observe GHG emissions from vehicles, monitoring and evaluation of TSM&O effects on GHG emissions may require a combination of observed data (e.g., changes in traffic conditions as a result of a project) and modeled data (e.g., emission factors relating emissions to those traffic condition changes). Modeling/analysis methods may be used to estimate the emission reductions from the entire portfolio of an agency’s projects, while field measurements on sample projects can help to confirm the validity of the models and provide project-specific traffic data.
Monitoring of TSM&O projects should consider the timeframe after which the project is implemented. For example, benefits of signal retiming may degrade over time as traffic patterns change. Regular retiming of signals may be needed to sustain GHG benefits over the long term. Guidance states that signals should be retimed every 2.5 to 3 years and that most agencies retime signals within a 5-year period (Gordon, 2010).
Sample Cost-Effectiveness of TSM&O Strategies
Table 16.5 provides examples of the estimated GHG benefits of TSM&O strategies. These include programmatic assessments of benefits at a state or national scale as well as individual project-level evaluations. By normalizing benefits into a cost-effectiveness metric of tons of GHG reduced per million dollars spent, it is evident that there is quite a range of impacts depending upon the types of projects and the evaluation methodology used. One study found negative impacts at a statewide level as a result of induced demand effects.
Table 16.5 Estimates of TSM&O GHG Cost-Effectiveness
| Source | Description | Location/Scale and Timeframe | Capital Cost | GHG Reduction, Tons, Annual | Annual $/Annual Ton | Annual Tons/Annual $ Millions1 |
| Moving Cooler | Ramp metering | U.S., 2020–2050 | $1.3B | 680,000 | 50 | 21,000 |
| Advanced traffic management/ integrated corridor management |
$10.8B | 1,200,000 | 240 | 4,300 | ||
| Traveler information | $2.0B | 100,000 | 500 | 2,000 | ||
| Incident management | $2.2B | 150,000 | 40 | 26,000 | ||
| Cambridge Systematics, Inc., and Oregon Systems Analytics (2016) | ITS strategies (per EERPAT analysis) | Massachusetts | (3,000) | NA | NA | |
| ITS Benefits Database | Advanced traffic signal control | Pittsburgh | $683,000 | 558 | 1202 | 1202 |
| Corridor traffic signal optimization | Allegheny Co, PA | $30,500 | 666 | 52 | 72,0002 | |
| Baker and Khatani (2017)4 | Traffic operational improvements | Massachusetts (94 projects) | $3,080,000 | 76 | 8603 4,0002 |
250 |
| Peters et al. (2009)5 | Traffic signal retiming | Portland, OR | $3,500 per intersection $530,000 for 135 intersections | 50 per intersection 15,000 for 135 intersections | 4–7 | 143,000–283,0002 |
Notes: Moving Cooler: An Analysis of Transportation Strategies for Reducing Greenhouse Gas Emissions (Moving Cooler) and Application of the Energy and Emissions Reduction Policy Analysis Tool (EERPAT) Greenhouse Gas Analysis Tool in Massachusetts: Final Report [Cambridge Systematics, Inc., and Oregon Systems Analytics, 2016] considered induced demand. The project-specific evaluations cited did not consider induced demand.
1 Cambridge Systematics, Inc., calculations based on source document data. Note that these estimates are provided for order of magnitude only; no consideration is made to adjust to the same year dollar values, discounting, or adjustment of emission rates as fleet efficiency changes.
2 Annual $/ton and tons/$ million estimate calculated by Cambridge Systematics, Inc., assuming 10-year project life.
3 Report authors’ calculation assuming a 50-year project life.
4 Baker, E.D., and S.N. Khatani (2017). Developing a Metric for the Cost of Green House Gas Abatement. Prepared for Massachusetts Department of Transportation, University of Massachusetts Transportation Center Report 17.01.
5 Peters, J., R. McCourt, and R. Hurtado (2009). Reducing Carbon Emissions and Congestion by Coordinating Traffic Signals. ITE Journal, April 2009.
16.12 Self-Assessment: Transportation Systems Management and Operations
A self-assessment worksheet is provided to help State transportation agencies assess their current level of engagement with GHG in TSM&O and determine next steps for increasing their level of engagement.
Click to download – Self-Assessment: 16.0 Transportation System Management and Operations