Appendix C. Bridge Replacement Example
- C.1 Emissions Sources
- C.2 Mitigation Strategies
- C.3 Tree Planting as an Offset
- C.4 Detour Route Emissions Displacement
- C.5 Takeaways
This example is a detailed explanation of the material summarized in the sidebar in Section 14.9. The unpublished analysis was conducted by Good Company.
C.1 Emissions Sources
In Portland, Oregon, the Portland Bureau of Transportation (PBOT) had to replace a bridge with a wood substructure after a fire that damaged the facility. PBOT requested greenhouse gas (GHG) analysis for the three proposed alternatives, the selection of materials, and the mitigation strategies to offset emissions. The quantity of each “material of focus” is what distinguishes the design alternatives in this analysis (Table C.1).
Table C.1 Example: Material Quantities for Bridge Project
| Material of Focus | Alternative 3-A | Alternative 3-B | Alternative 3-C |
| Deck Concrete (cubic yards) | 520 | 570 | 570 |
| Deck Steel Reinforcement (pounds) | 151,040 | 162,640 | 162,640 |
| Precast Beam Concrete (cubic yards) | 1,042 | 779 | 0 |
| Precast Beam Steel Reinforcement (pounds) | 168,840 | 126,180 | 0 |
| Structural Steel Beams (pounds) | 0 | 0 | 837,900 |
Three sources of GHG emissions, related to the materials of focus, are studied in this analysis:
- Embodied emissions in materials: The embodied emissions in the construction materials (steel, concrete, etc.) are those emissions resulting from raw material extraction, processing, product manufacture, and all transportation up to the point of retail (known as cradle-to-gate analysis).
- Transportation emissions: The movement of materials requires the combustion of diesel fuel, which in turn creates GHG emissions.
- Disposal emissions: Disposal of deconstruction materials in a landfill generates GHG emissions while recycling materials displaces emissions.
Table C.2 shows the subcomponents of the bridge alternatives, the material mixes assumed to be chosen at this stage of design, and the emission factors per metric ton of materials.
Table C.2 Example: Emissions Intensity of Bridge Materials
| Drug Enforcement Administration Material Description |
Used in Bridge Design | Infrastructure Carbon Estimator (ICE) Material Description | ICE Embodied Emissions Intensity |
| Concrete HPC 4500 | Alt-3A, Alt-3B, Alt-3C |
Concrete 1:1:5 (cement:sand:aggregate) |
0.159 MT CO2e/MT |
| Reinforcement (uncoated) | Alt-3A, Alt-3B, Alt-3C | ICE (v1.6a): Steel: Bar and Rod (recycled content not specified) | 1.71 MT CO2e/MT |
| PS Deck Bulb-T (60” dp)—Concrete (6500) | Alt-3A | Concrete 1:1:5 (cemment:sand:aggregate) |
0.159 MT CO2e/MT |
| PS Deck Bulb-T (60” dp) )—Steel Reinforcement | Alt-3A | ICE (v1.6a): Steel: Bar and Rod (recycled content not specified) | 1.71 MT CO2e/MT |
| PS BT72 Beams—Concrete (6500) | Alt-3B | Concrete 1:1:5 | 0.159 MT CO2e/MT |
| PS BT72 Beams—Steel Reinforcement | Alt-3B | ICE (v1.6a): Steel: Bar and Rod (recycled content not specified) | 1.71 MT CO2e/MT |
| Structural Steel (ASTM 709, Gd 70W) | Alt-3C | ICE (v1.6a): Steel: General Steel (recycled content for genera is 42.7% | 1.77 MT CO2e/MT |
Notes: MT = Metric Ton; CO2e = Carbon dioxide equivalent.
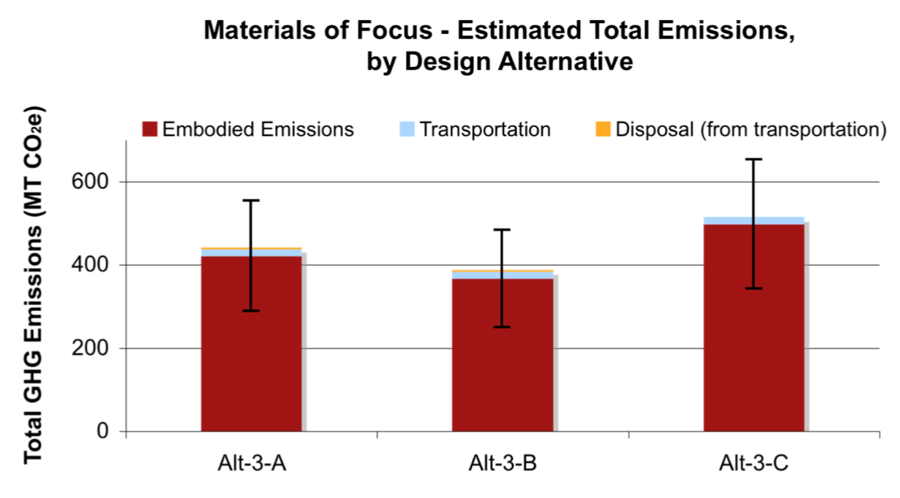
The quantities of material were then multiplied by the emission factors to determine the total GHG footprint for each alternative. Note that emissions embodied in the materials are the vast majority of emissions compared with the fuel needed to construct the alternatives and dispose of the defunct bridge (Figure C.1).
Figure C.1 Example: Comparison of Emissions for Materials, Transportation, and Disposal of Bridge Materials
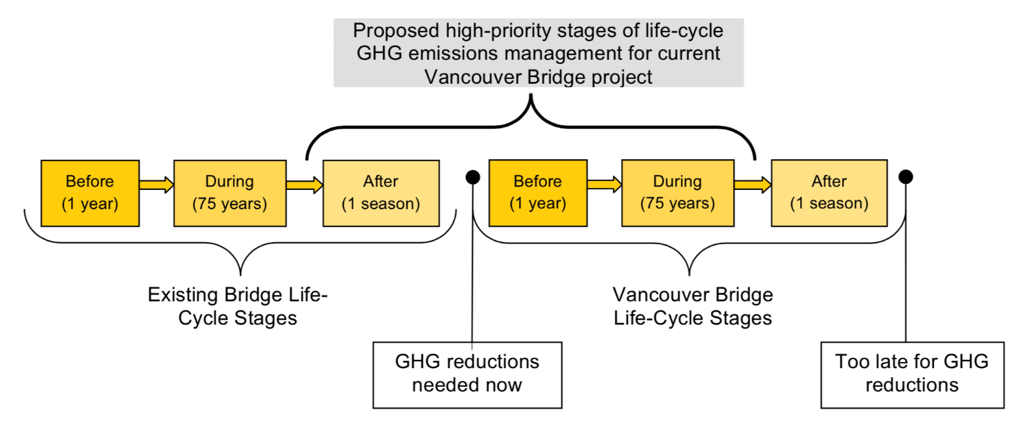
After the design alternative was selected and brought to 60 percent design, a life-cycle GHG inventory was produced for the proposed design using this rationale (Figure C.2).
Figure C.2 Life-Cycle Analysis of Bridge Project
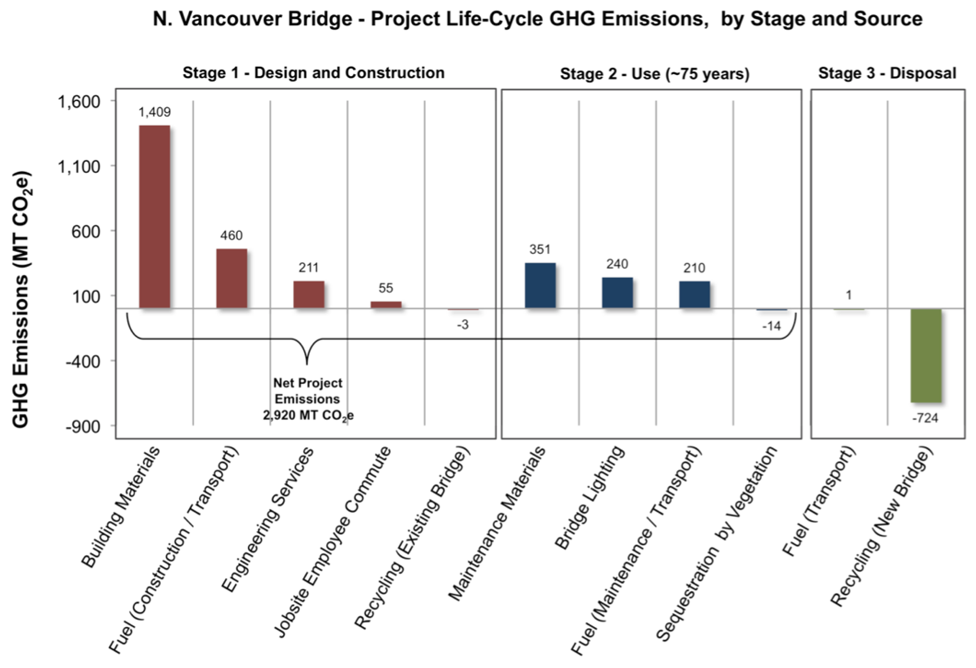
The life-cycle inventory of the new bridge showed these results and relative emissions intensity (Figure C.3). Of the net design, construction, and maintenance emissions of 2,920 mt CO2e over its 75-year lifetime, almost one‑half is from building materials. Recycling in disposal has the potential to offset about one-quarter of the life-cycle emissions. Note that emissions from traffic using the bridge (typically orders of magnitude higher than these) are not included.
Figure C.3 Life-Cycle Emissions by Source—Example Bridge Project
C.2 Mitigation Strategies
Potential mitigations were then evaluated—strategies to recover the embodied emissions by reusing bridge components, reducing embodied emissions through cement substitutions with fly ash, and specifying lower carbon diesel for the work. The results are shown in Table C.3. Again, emissions from traffic using the bridge (typically orders of magnitude higher than these) are not included.
Table C.3 Bridge Example—GHG Mitigation Reductions
| Emissions Reduction Strategies | Maximum Potential Reductions MT CO2e/MT |
| 1. Deconstructed Materials Management | -1,774 |
| a. Existing Bridge | |
| i. Wood | -1,031 |
| ii. Steel | -11 |
| iii. Concrete | -8 |
| 2. Increase Recycled Content | -695 |
| b. Concrete—Fly Ash Substitution | Alt-3B |
| i. Deck Concrete | -657 |
| ii. Precast Beams | -30 |
| 3. Low-Carbon Fuels and Fuel Efficiency | -161 |
| a. Low-Carbon Fuels | |
| i. B20 in Construction Equipment | -122 |
| b. Fuel Efficiency | |
| i. Anti-Idling Policy | -17 |
| ii. Equipment Efficiency | -22 |
| Maximum Potential Reduction | -2,630 |
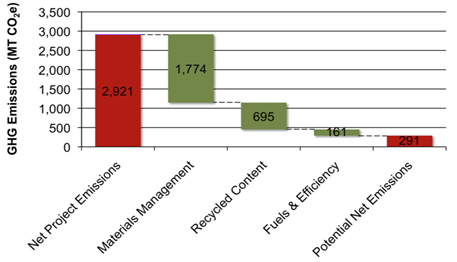
If all of the GHG-reducing strategies were deployed in the construction of the new bridge, nearly 90 percent of emissions could have been avoided on net (Figure C.4).
Figure C.4 Effect of Reduction Strategies on Net Project Emissions
C.3 Tree Planting as an Offset
Planting trees is a potential carbon offset strategy for this project available to PBOT as the steward of large parcels of land. To determine if this strategy is feasible and an opportunity worthy of pursuit, the number of trees (necessary to sequester carbon dioxide equal to gross project emissions) and associated acreage have been estimated.
This estimate uses the Department of Energy’s Method for Calculating Carbon Sequestration by Trees in Urban and Suburban Settings and Modeling Douglas-Fir Growth and Yield in the Pacific Northwest.[C-1] The estimate assumes the trees species is Douglas Fir and that each tree would have a maximum lifespan of 30 years. Based on these assumptions, it is estimated that 18,700 trees would be needed to sequester the gross life-cycle emissions of the bridge. If one acre can support 400 trees, the offset tree population would require about 50 acres.
C.4 Detour Route Emissions Displacement
Rebuilding the N. Vancouver Avenue Bridge reestablishes a transportation route used daily by many passenger and freight-hauling vehicles. A 2005 survey found that over 1,500 passenger vehicles, 100 buses, and 1,300 freight vehicles traveled the northbound and southbound lanes daily. These vehicles currently are detoured, adding 0.6 miles to the trip from one side of the bridge to the other. This small per-trip increment translates into an additional 50,000 gallons of fuel consumed each year, or about 500 mt CO2e.
Assuming the bridge will have a 75-year life span and that vehicle fuel efficiency will continue to increase at a rate equal to what has been experienced over the past 30 years, it is estimated that 25,000 mt CO2e will be displaced as a result of rebuilding the bridge and effectively shortening the total transportation distance.
C.5 Takeaways
Key takeaways from this example include the following:
- Reuse of deconstructed materials in other applications had the largest benefit for this bridge.
- Use of recycled content in material mixes could reduce the life-cycle emissions of the bridge facility by approximately 30 percent above and beyond the 10–15 percent existing fly ash content of the concrete mixes originally specified.
- Fuel switching to lower carbon diesel makes an easy change with results, but onsite fuel use and fuel used in delivery of materials constitute a smaller portion than may be expected.
- The hard cost of purchasing carbon offsets instead of implementing any technical strategies is equal to 2,921 MT times the cost of 2019 California regulatory grade offsets ($15/MT) = $43,815 for the life-cycle GHG emissions. The cost of offsets may be smaller than making any technical changes in the unique project that reduce the equivalent GHGs. Note this does not include the cost of emissions mitigation if the standard specification were to be modified and the new mixes came to market at scale due to the scale of annual department of transportation demand. Also note the emissions from the users of the bridge, although the emissions from using the bridge versus using the next closest route to cross the waterway are dramatically smaller.
[C-1] Accessed at: http://www.urbanforestrysouth.org/resources/library/method-for-calculating-carbon-sequestration-by-trees-in-urban-and-suburban-settings-1/.