3.0 Scenario Planning for an Uncertain Future
- 3.1 Establishing Future Baseline(s) of Emissions
- 3.2 Scenario Planning Methods
- 3.3 Tools to Support GHG Scenario Planning
- 3.4 Examples of State DOT Scenario Planning for GHG Reduction
The sustainability question most on the minds of many policy-makers and agency executives these days is how we can possibly achieve the greenhouse gas (GHG) reductions required to meet the aggressive targets (80 percent or more by 2050) needed to meet local and international accords and keep global climate change to manageable levels.
Further confounding this question is widespread uncertainty over emerging and future technologies and economic factors—electric battery costs, automation, the price of oil, solar and wind power, even flying vehicles such as drones—and how these might turn out to be beneficial or detrimental to GHG reduction efforts. Transportation planning has never been an exact science, but given the pace of technological change, uncertainties are perhaps greater than in the previous decades of planning.
Scenario planning is a technique for dealing with uncertainty by planning courses of action that will yield robust outcomes under multiple possible future scenarios. Transportation and other agencies are increasingly joining the private sector in applying scenario planning methods. This section describes scenario planning methods and how they can be used to identify transportation trajectories to meet deep GHG emission reduction targets.
3.1 Establishing Future Baseline(s) of Emissions
Long-range plans, energy and climate action plans, and similar efforts typically start with a baseline forecast—how the conditions in the State are expected to look in 20 to 30 years considering current trends or “business as usual” conditions. The first step in scenario planning is to acknowledge the uncertainty that exists in the baseline forecast. For example, even without further policy actions at the State level, GHG emissions could be higher or lower than projected in 20 years due to factors such as
- Different than expected rates of population, job, or income growth.
- Demographic and socioeconomic changes that lead to more or less travel (e.g., aging population, workforce participation rates, increased telecommuting).
- Consumer preferences for different forms of transportation and different living environments (e.g., urban versus rural).
- Changes in energy prices that might increase or decrease consumer demand.
- Policies at other levels of government (local, Federal) that affect transportation demand, vehicle efficiency, or the carbon intensity of travel, such as changes to Federal fuel efficiency and GHG standards.
- Other political or economic disruptions.
3.2 Scenario Planning Methods
Scenario planning methods can be used to consider what State-level GHG emission reduction strategies might be most effective and desirable to implement given future goals combined with uncertainties in technology, economics, and other factors. The Federal Highway Administration (FHWA) describes scenario planning as a method that helps transportation agencies work with stakeholders and the public to establish a vision and implement a strategic plan for success in uncertain times. Scenarios are stories about the future that planners develop to consider and prepare for possible challenges and opportunities. Scenario planning typically includes both qualitative and quantitative analyses to illustrate the tradeoffs between different futures and their relative impacts on different community goals (FHWA, 2016a).
NCHRP Report 750: Strategic Issues Facing Transportation, Volume 5: Preparing State Transportation Agencies for an Uncertain Energy Future discusses how long-range planning efforts can take place in the context of uncertain, but potentially significant, shifts in transportation fuels through the 2050 timeframe (NCHRP Report 750 Vol. 5, 2014). While this report focuses on energy for highway vehicles, the methodology used could easily be applied to other lines of inquiry, including factors related to GHG emissions. To assist in developing effective long-range plans in the context of an uncertain future, the first steps are to agree on what process or condition is uncertain and the entity that is planning for the future. Planners then can take the following steps:
- Step 1: Develop a broad range of plausible scenarios, or futures, for plausible horizons such as 20, 30, or more years.
- Step 2: Examine how the scenarios might adversely affect the current and planned activities of the planning entity.
- Step 3: Employ the principles of robust decision-making to evaluate and identify strategies to respond to alternate futures. Robust decision-making is a method for long-term policy analysis in the context of uncertainty that seeks to identify strategies that are robust under multiple futures.
- Step 4: If the long-term policy analysis yields enough specificity to formulate short-term actions, proceed with the short-term actions. Refine/revisit scenarios as warranted.
An example in the context of GHG emissions might be consideration of alternative future growth in disruptive technologies such as ridehailing and automation. A robust decision-making process would consider alternative growth trajectories and behavioral effects. It would then identify short-term policies (such as surcharges on solo rides) to manage negative GHG impacts as well as mileposts (such as electrification requirements or GHG targets for service providers) to track the need for more aggressive management policies.
3.3 Tools to Support GHG Scenario Planning
Some of the challenges in conducting scenario planning analysis include
- Lack of available tools that provide sufficient detail on individual strategies but also sufficient breadth in terms of evaluating a wide range of strategies.
- Management of output from multiple (potentially numerous) scenarios corresponding to different levels of a wide range of input variables and their combinations.
- Communication of information from a range of strategies and potential futures in a simple format that can be readily understood by decision-makers and the public.
- “On-the-fly” visualization of impacts to support interactive scenario assessment with stakeholders.
A small but expanding set of tools designed to specifically support scenario planning is available, including assessment of GHG strategies at a statewide or regional level, management of multiple input and output sets, and visualization of results. Some of these are listed in Table 3.1.
Table 3.1 GHG Scenario Planning Support Tools
| Tool | Description | References/Examples |
| VisionEval | An open-source transportation policy evaluation tool, including GHG evaluation; functionality for scenario management and visualization are continually being enhanced. | Corvallis Metropolitan Planning Area Scenario Viewer: https://www.oregon.gov/ODOT/ Planning/PTVSV/CAMPO/index.html |
| Impacts2050 | A spreadsheet tool focused on demographic scenario analysis to determine the impacts of sociodemographic factors in future travel demand. Useful for considering factors such as changes in vehicle occupancy from shared mobility that may not be considered in other tools. | NCHRP Report 750 Vol. 6 |
| Travel Model Improvement Program Exploratory Modeling and Analysis Tool | A partially automated utility that can be integrated with existing travel demand and other models to facilitate the application of those models in an exploratory, rather than predictive, manner (i.e., to explore multiple scenarios rather than developing one future prediction). Applies evolving sensitivity and risk analysis approaches and incorporates exploratory-type visualizers to present and analyze the results. | Oregon Department of Transportation (DOT) – see Travel Model Improvement Program Webinars: https://tmip.org/webinars |
| Land Use Scenario Planning Tools | Geographic information system (GIS)-based decision support software for land use and transportation scenario planning. Primarily designed for land use scenario evaluation, but GHG emissions are reported and some transportation strategies can be evaluated. | Charting a Sustainable Growth Plan for California (UrbanFootprint): https://urbanfootprint.com/case-studies/vision-california/Examples: UrbanFootprint, Envision Tomorrow, CommunityViz |
3.4 Examples of State DOT Scenario Planning for GHG Reduction
The following examples illustrate how different States have conducted scenario planning to identify trajectories towards meeting overall GHG reduction goals and what strategies are needed to maintain those trajectories. Note that the baseline projections in these studies were based on the latest available planning assumptions at the time of each study, and trends or actions since the time of the study (such as new Federal fuel efficiency and GHG standards) could lead to a different baseline picture than illustrated here. Life-cycle emissions impacts are also included to varying degrees and may be treated in different ways in each study, which may affect conclusions about the relative emissions benefits of biofuels and electrification.
Some observations that can be made from transportation GHG scenario planning initiatives include:
- Clean vehicle and fuel technologies—including vehicle efficiency/GHG emissions standards, electrification, and other low-carbon fuels—are likely to make up the majority of emission reduction potential. For the most part, departments of transportation (DOTs) do not directly control policy related to these strategies, but DOTs can play important supporting roles, such as developing electric vehicle (EV) infrastructure.
- Demand reduction and systems efficiency strategies also play an important role in reducing GHG emissions. The estimated reduction potential ranges from modest (a few percent) to significant (10s of percent) depending upon the strategies that are included and the level of aggressiveness assumed. Some of the more optimistic estimates of reduction potential rely on unproven technologies (such as connected vehicles supporting “eco-driving”) or very high levels of pricing that are generally unattainable in today’s environment.
- Pricing and operations strategies can also serve as levers in promoting EV adoption or increasing vehicle occupancy—for example, through strategic deployment of charging infrastructure and through preferential access to managed lanes, parking, curbside access, or service markets such as airports.
- Even with a combination of all strategies applied at aggressive levels of implementation, it is challenging to meet targets of 75 to 80 percent GHG reduction or more by 2050. Studies are in general agreement that doing so will require widespread electrification, decarbonization of the electric grid, and policies to manage vehicle travel demand.
- Most strategies require implementation at multiple levels (State, regional, local) and across multiple agencies and organizations (executive, transportation, environmental, community development, utilities, etc.) to be fully effective. DOTs cannot “go it alone” when it comes to reducing transportation emissions.
3.4.1 Oregon Statewide Transportation Strategy
The Oregon Sustainable Transportation Initiative is an integrated statewide effort begun in 2010 to reduce GHG emissions from the transportation sector.[1] The initiative is designed to meet Oregon’s climate goal, which is aligned with keeping global average temperature increases to 2°C, or a GHG atmospheric concentration of no more than 450 parts per million. Designed to help Oregon meet its long-range goals to reduce GHG emissions by 75 percent by 2050, the initiative encompasses five focus areas:
- Development of a Statewide Transportation Strategy.
- Adoption of GHG emission reduction targets for metropolitan areas by the Land Conservation and Development Commission.
- Development of land use and transportation scenario planning guidelines for GHG emissions reduction.
- Outreach to the public on climate change.
- Development of the Greenhouse Gas Transportation Emissions Reduction Toolkit, with tools that support local governments in reaching their emissions reduction goals.
The Oregon Statewide Transportation Strategy (Oregon DOT, 2013) charts a potential broad path for reducing emissions from transportation and land use strategies that modeling and analysis have shown to have measurable GHG reduction results to meet a 2050 GHG emission reduction goal. Current trends at the time of this study were expected to reduce GHGs by over one-third in the ground passenger and commercial service sectors, with about half the reduction coming from direct DOT actions. However, increasing freight and air emissions were projected to keep total 2050 emissions around 2010 levels.[2] The Statewide Transportation Strategy contains 18 strategies that fall into the following categories: vehicle and engine technology advancements, fuel technology advancements, enhanced system and operations performance, freight transportation options, efficient land use, and pricing and funding mechanisms. It includes a short-term implementation plan and a monitoring report to chart progress on implementation and was adopted as an amendment to the Oregon Transportation Plan in 2018. The Statewide Transportation Strategy anticipates a 60 percent reduction in GHG emissions from the transportation sector from 1990 levels by 2050, short of the legislatively required 75 percent reduction but still a significant decrease. The Statewide Transportation Strategy notes that achieving 75 percent reductions will be especially challenging in the freight and air passenger market segments. Figure 3.1 compares 1990 and 2050 emissions by travel market segment.
Figure 3.1 Oregon GHG Emissions by Travel Market Segment
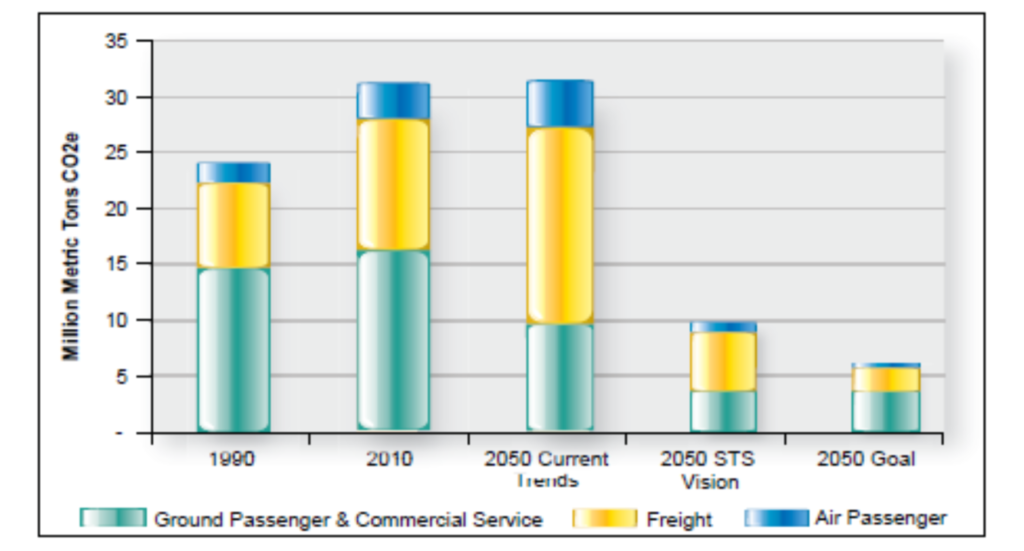
Source: Oregon DOT, 2013.
The Oregon Statewide Transportation Strategy further provided estimates of the potential reductions from various categories of mitigation strategies. Figure 3.2 shows that about 40 percent of emissions can be mitigated through strategies potentially led by the DOT, including pricing, transportation options, and intelligent transportation systems (ITS). Another 40 percent can be mitigated through more efficient vehicles and low-carbon fuels affected by broader State or Federal policy. For the remaining emissions, reduction strategies will need to be identified in the future.
Figure 3.2 2050 Transportation System GHG Reduction Potential in Oregon
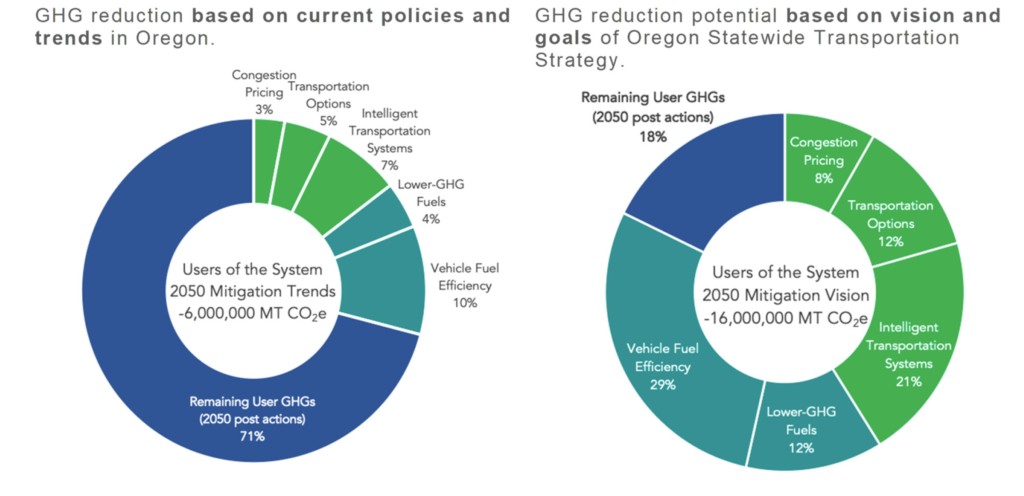
Source: Calculations by Good Company based on data from the Oregon Statewide Transportation Strategy (Oregon DOT, 2013) and the Statewide Transportation Strategy: A 2050 Vision for Greenhouse Gas Emission Reduction—2018 Monitoring Report update (Oregon DOT, 2018b).
3.4.2 Maryland DOT Climate Action Plan
The Maryland DOT has developed and updated a GHG reduction plan specific to the transportation sector, first published in 2012 and last updated in 2015. The plan implements the Maryland Greenhouse Gas Emissions Reduction Act of 2009, requiring Maryland to achieve a 25 percent reduction in 2006 GHG emissions by 2020, for the transportation sector. The plan develops baseline and future GHG emission levels; identifies funded, unfunded, and additional transportation programs to meet State-established GHG emission reduction targets; and identifies costs of actions. The plan includes an assessment of GHG-mitigating projects included in the FY2015–FY2020 Consolidated Transportation Program.
Figure 3.3 shows the baseline (business as usual, or BAU) forecast and the contribution of various GHG reduction initiatives. Federal and State motor vehicle emissions and fuel standards were projected to reduce emissions by about 3 million metric tons (mmt) compared to the projected 2020 baseline of 44 mmt, and additional clean vehicle programs were (if implemented) projected to further stabilize emissions at 2006 levels, compared with a substantial increase without these standards and programs. Additional initiatives—focused on public and intercity transportation, pricing, and bike and pedestrian improvements—were projected to have the potential to reduce emissions from 35 million metric tons in 2006 to about 30 mmt in 2020.
The plan was developed using a number of tools and data sources:
- The MOVES2014 model was used to develop the on-road portion of the emissions inventory, using vehicle miles traveled (VMT) and other traffic data from the State Highway Administration, with forecasts based on historic trend projection.
- Some adjustments were made to Motor Vehicle Emission Simulator (MOVES) emission rates to capture recent fuel efficiency standards not captured in the latest release of MOVES.
- Nonhighway emissions were estimated from a variety of sources.
Travel demand and operations strategies were evaluated using a variety of methods, generally implemented as custom applications in spreadsheets developed by the agency’s consultants.
Figure 3.3 2020 Transportation GHG Emissions Projections in Maryland
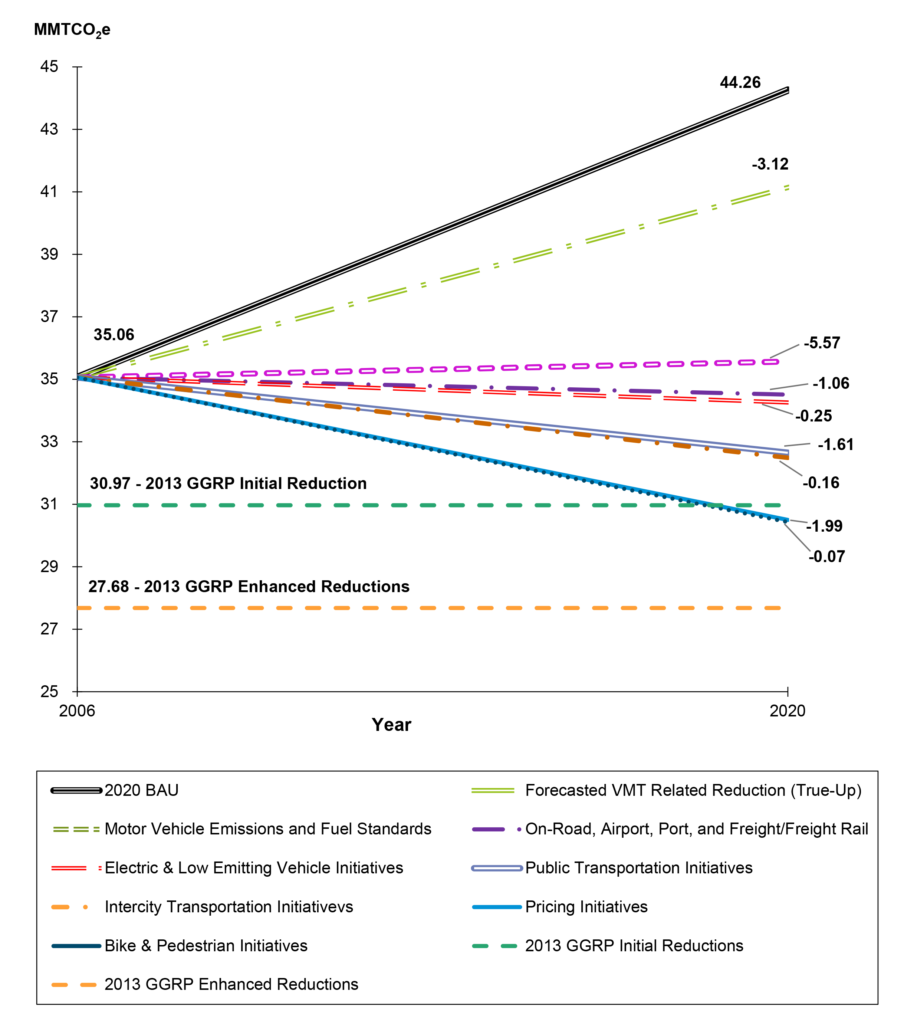
Source: Maryland DOT, 2015. State of Maryland’s Greenhouse Gas Reduction Act Plan (GGRP) of 2013.
3.4.3 Massachusetts DOT—Application of EERPAT
This example shows how a much more limited policy focus might lead to a much lower estimated mitigation potential. In this application of the FHWA Energy and Emissions Reduction Policy Analysis Tool (EERPAT) tool, Massachusetts DOT (MassDOT) focused strictly on policies and actions under the DOT’s direct control, such as planning and investment decisions and purchasing, and compared financially and politically feasible incremental actions against the baseline of existing plans and policies. The result is a modest, yet positive, impact on GHG emissions that will contribute to overall statewide GHG reduction goals.
Table 3.2 compares the current (Scenario B) and proposed (Scenarios C and D) policies that were modeled. Policies were divided into those that could be directly implemented by MassDOT (Scenario C) and policies that would require action by other State and local agencies (Scenario D). Proposed additional policies are compared with current policies.
Table 3.2 GHG Reduction Policies Evaluated in Massachusetts
| Policy | Scenario B, Current Plans and Policies |
Scenario C or D, Additional Policies |
|
| Scenario C, Additional MassDOT Policies | |||
| Transit Investment/ Service |
Zero per-capita growth (trend) | ~1% simple annual increase in per-capita vehicle revenue-miles | |
| Clean Buses | Current Federal standards | All hybrid buses purchased statewide in 2017; electric bus purchasing phased in 2021 to 2029 | |
| Bicycle Infrastructure | Estimated increase in bicycling based on 5-year/20-year State and regional plans | Additional investment ($ and facility-miles) to triple bike mode share from current levels by 2030 | |
| Travel Demand Management | Current MassRides/ MassCommute participation |
Additional funding to reach employers with >100 employees, increasing workforce reached from 25% to 37% | |
| ITS | Funded expansion consistent with ITS strategic plan |
Expansion of incident management to all eastern Massachusetts highway segments; deployment of adaptive signal coordination on 500 more State signals by 2030 | |
| Scenario D, Other State and Local Policies | |||
| Land Use/ Smart Growth |
Current metropolitan planning organization (MPO) forecasts | At least 80% of new households located in mixed-use areas in 2020 to 2030; 90% in 2030+ | |
| Electric Vehicles | California 10% Zero Emission Vehicle (ZEV) rule through 2025, flatline thereafter | $25 million in additional annual State subsidies to increase sales through 2030 | |
| Mileage-Based Fee | None | VMT fee of 0.6 c/mi | |
| Congestion Pricing | None | Severely congested: $0.25/mi Extremely congested: $0.50/mi Existing tolled Boston MPO highways only (alternative policy test—apply to all Boston MPO limited-access highways) |
|
| Clean Fuels Standard | Environmental Protection Agency (EPA) Renewable Fuel Standard-2 | 10% carbon intensity reduction versus gas/diesel by 2030 | |
| Parking Pricing | Current conditions, based on 2011 Massachusetts household travel survey | Double average cost of parking and % of trips paying for parking by 2035, through requirements or incentives for paid parking | |
Source: Cambridge Systematics, Inc., and Oregon Systems Analytics, 2016.
Figure 3.4 shows the resulting baseline and scenario estimates of direct, on-road transportation emissions, in mmt of CO2e per year. Historical data for 1990 to 2010 are from the Commonwealth’s inventory. Scenario B, the baseline scenario, shows a rapid decrease between 2015 and 2030 with a much smaller decline by 2040, driven primarily by Federal fuel efficiency standards (through Model Year 2025 for light-duty vehicles and Model Year 2018 for heavy-duty vehicles). Scenario C, MassDOT policies and investments, shows an additional decrease of about 0.4 mmt CO2e or 2 percent of on-road emissions in 2030 and beyond. Scenario D, other State and local policies, shows an additional decrease (versus Scenario B) of about 0.9 mmt CO2e or 5 percent of on-road emissions.
Figure 3.4 Massachusetts On-Road Direct Transportation Emissions Under Baseline and Additional Policies Scenarios
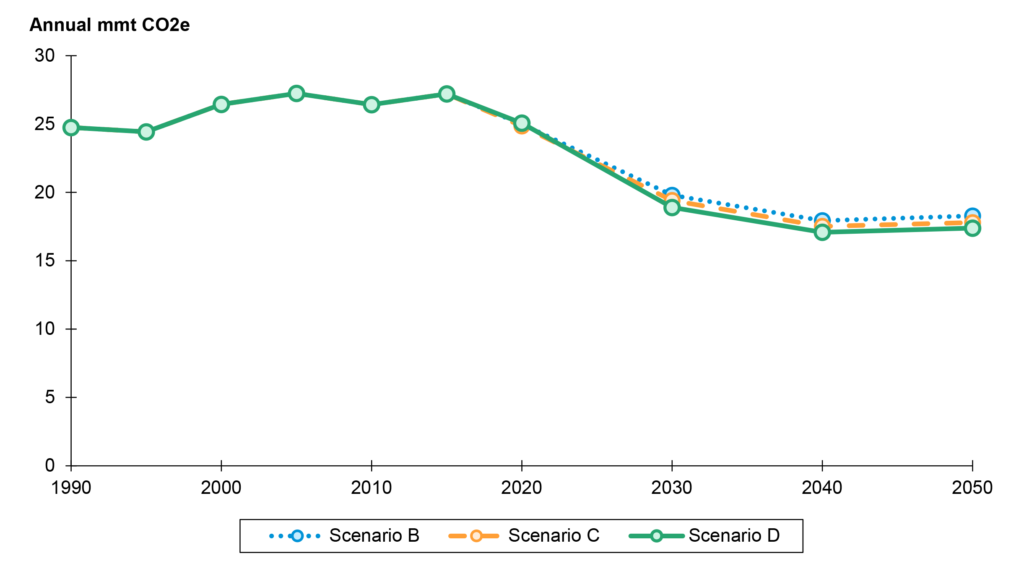
Source: Cambridge Systematics, Inc., and Oregon Systems Analytics, 2016.
3.4.4 Minnesota DOT—Pathways to Decarbonization
In 2019, Minnesota DOT (MnDOT) contracted with Energy and Environmental Economics, Inc. (E3) to use its PATHWAYS model to examine future pathways to decarbonization of the transportation sector. The PATHWAYS model is an economy-wide infrastructure-based GHG and energy analysis tool. The model captures lifetimes and vintages of buildings, vehicles, and equipment; models physical energy flows within all sectors of the economy; and allows for comparison between user-defined scenarios. The model does not describe how the modeled strategies would be implemented. For instance, the model indicates how many EVs might need to be on the road by a certain date to achieve the emission reduction goals but does not say what specific policies or incentives are needed to get there.
Technical stakeholders provided input throughout the modeling process to identify the most important decarbonization strategies to reduce transportation carbon pollution, develop and review assumptions, and offer feedback on draft results. Three scenarios were modeled—a Reference Scenario; an 80 x 50 Scenario to reflect the statutory target of an 80 percent GHG reduction by 2050; and a 100 x 50 Scenario to explore strategies to reduce emissions to zero by 2050. The scenarios include assumptions about EVs, clean fuels, VMT reduction, and mobile refrigerants. Figure 3.5 shows the resulting emission reductions from each type of strategy for the 80 x 50 Scenario compared to the baseline forecast (top of the “fuel economy standards” wedge). VMT reductions were estimated based on TRB’s Special Report 298 (TRB/NRC, 2009).
Figure 3.5 MnDOT 80 x 50 GHG Reduction Scenario
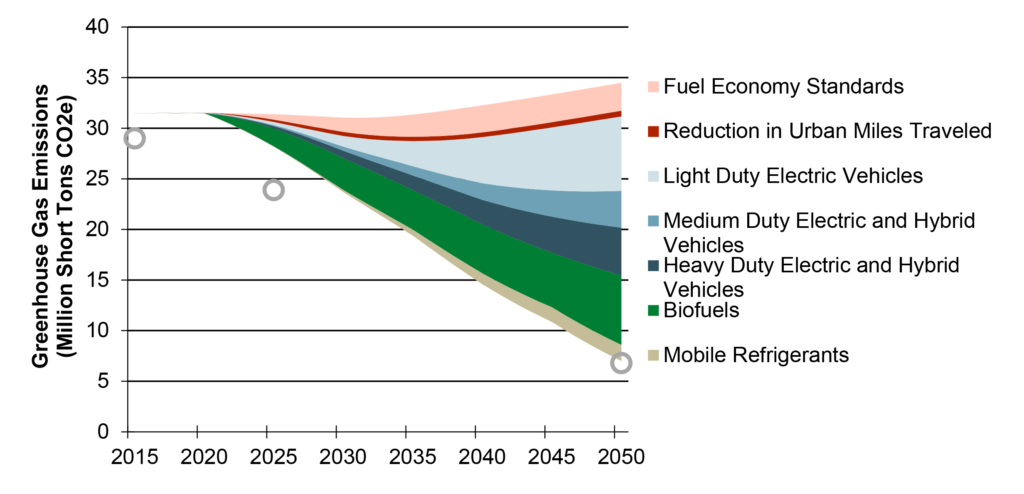
Source: MnDOT, 2019. Circles represent state goals or targets.
3.4.5 Carbon-Free Boston
A final example is taken from Carbon Free Boston—Summary Report 2019, authored by the Boston Green Ribbon Commission and Boston University. While this study is focused on a substate geographic area, it is noteworthy for taking a hard look at how a major U.S. city could make its transportation sector carbon neutral—or close to it—by 2050. This study also looked at the potential impact of emerging modes and technologies, including shared mobility and autonomous vehicles. The study concluded that widespread electrification of the transportation sector was needed, along with a clean electricity grid. Additional policies to manage and reduce travel demand (such as cordon pricing, transit investment, bicycle investment, and land use) would help manage new demands on the electricity grid, reduce emissions that were not eliminated through clean electrification, and provide equitable mobility options. Figure 3.6 shows the contribution of each major category of transportation strategy to reducing emissions. The remaining “gap” is mainly from long-distance, heavy-duty vehicles, which would need to be offset since they are beyond the city’s sphere of policy influence.
Figure 3.6 City of Boston Transportation GHG Emission Scenarios
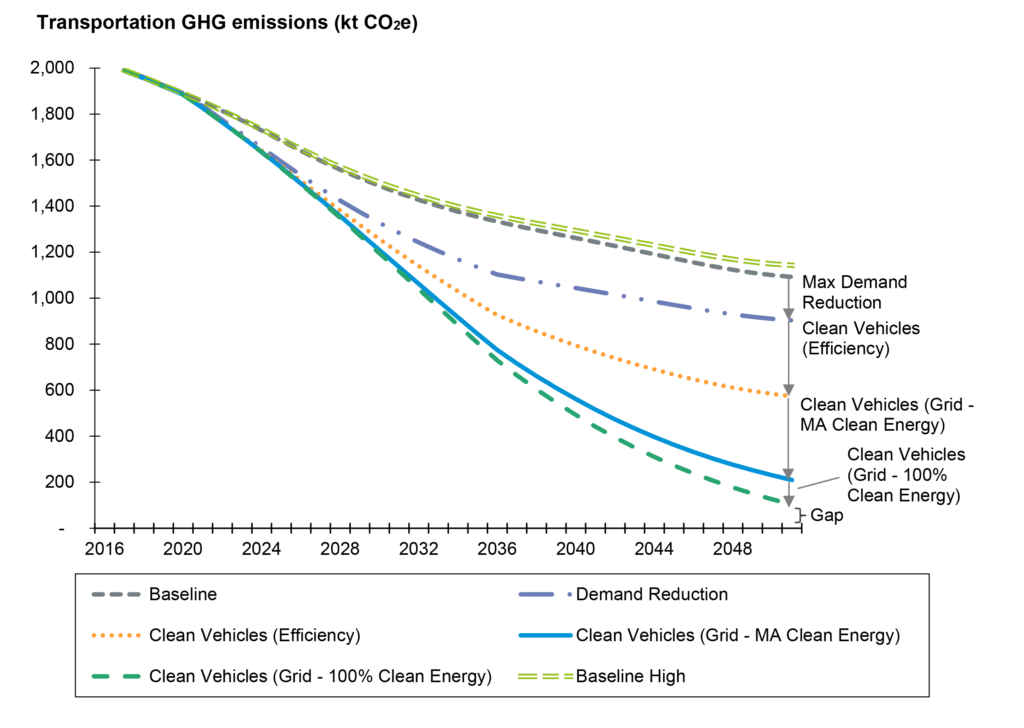
Source: Carbon Free Boston—Summary Report 2019, Boston Green Ribbon Commission and Boston University.
[1] https://www.oregon.gov/odot/programs/pages/climate-change.aspx.
[2] Additional Federal GHG/fuel economy standards adopted since the time of the Statewide Transportation Strategy analysis would be expected to reduce the “current trends” scenario emissions somewhat.