- What are other people doing and what is available?
- How do we change behavior?
- How do I know my program is working?
- What can help me plan my safety program?
Overview
How to change behavior
Traffic safety programs are about changing behavior. Unfortunately, few theories of behavioral change directly address traffic safety. However, theories of behavioral change created to address other behaviors and issues are still relevant and applicable to traffic safety because they address the fundamental elements of behavioral change. The following material provides a brief overview of common behavioral change theories. In comparing these theories, keep in mind that programs targeting individual behaviors and outcomes are different than those that target organizational behaviors and outcomes.
OverviewHere are some examples of theories that you can use to change behavior
- Diffusion of Innovation Theory
- Kotter’s 8-Step Change Model
- Lewin’s Three-Step Change Theory
- Nudge Theory
- Social Cognitive Theory
- Health Belief Model
- Social-Ecological Model
- Transtheoretical Model of Change
- Workplace Health Model
- Theory of Planned Behavior
The diffusion of innovation theory focuses on explaining how an innovation (e.g., idea or behavior) diffuses throughout a population (Rogers, 2010). The theory consists of four components that influence the diffusion of an innovation:
- The innovation or idea.
- The communication channels used to spread the innovation.
- The time needed for diffusion to occur.
- The social system that influences adoption of the innovation.
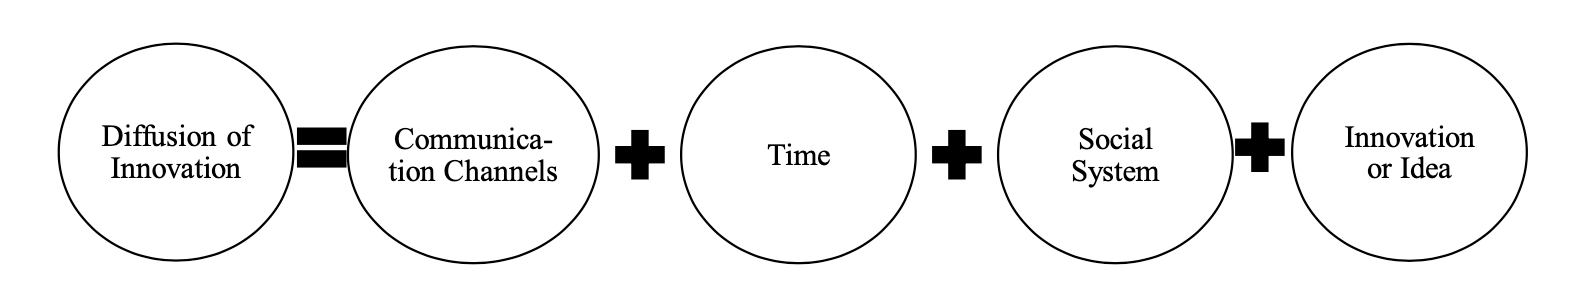
Primary Source: Rogers (2010)
Kotter’s 8-step change model is an organizational change model (Kotter, 1996), the steps of which are shown below:
- Create urgency by making employees aware of the existing problem and possible solution.
- Form a powerful coalition with a wide range of skills.
- Form a strategic vision that is easy for all employees to understand.
- Enlist a volunteer army to communicate the vision.
- Enable action by removing obstacles.
- Generate short-term wins through rewards and short-term targets.
- Sustain acceleration by building upon changes.
- Institute lasting change by anchoring changes in organizational culture.
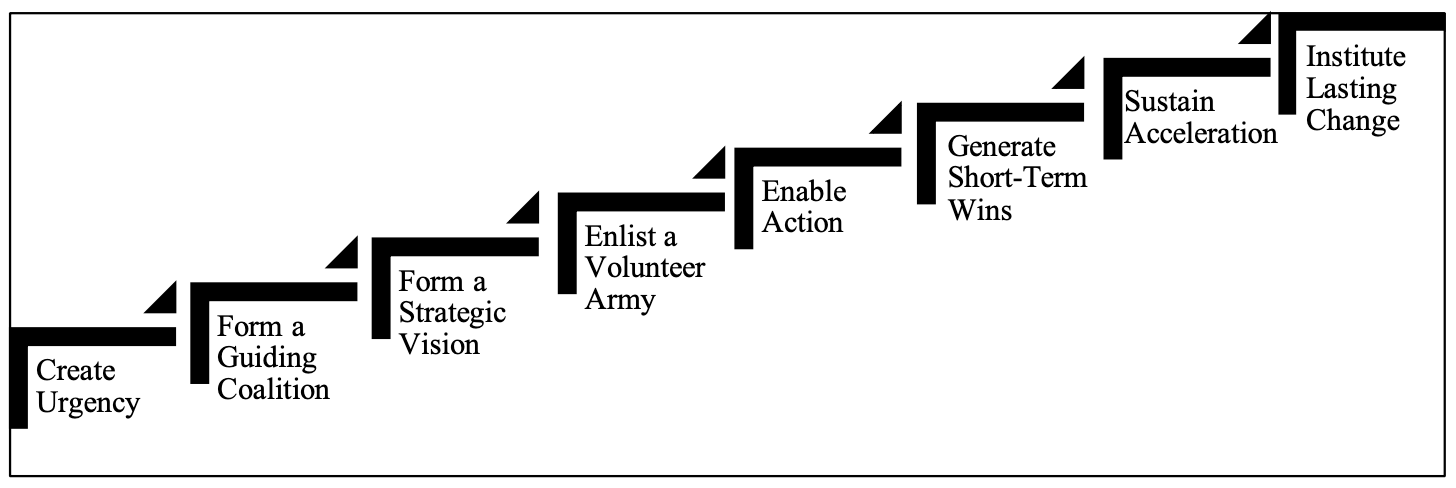
Primary Source: Kotter (1996)
Lewin’s three-step change theory operates on the premise that behavior change is influenced by driving and hindering forces (Lewin, 1951). There are three steps to Lewin’s model. The first involves an unfreezing of current behavior and ensuring that individual and group influence promotes change (Schein, 1996). During the second step, behavioral change occurs through programs or policies. Last, there is a refreezing of the new behavior to ensure long-term commitment.
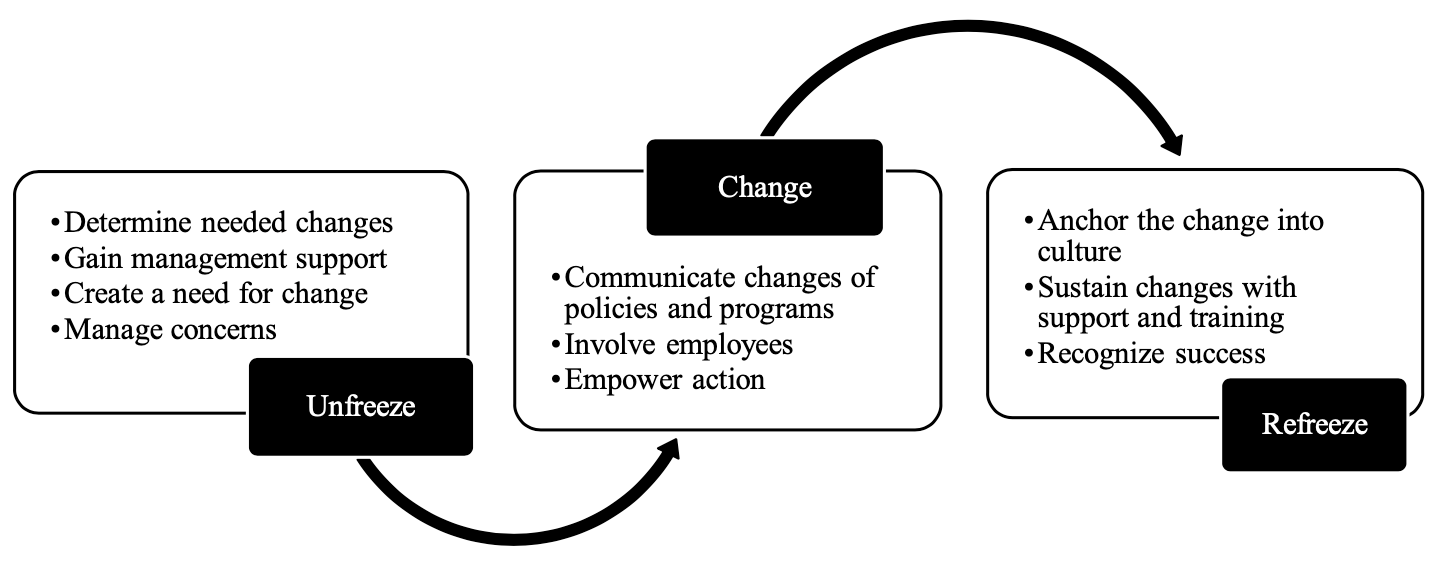
Primary Source: Lewin (1951)
Nudge theory provides a process to influence behavior change without imposing strict regulations. Recognizing that biases influence a person’s likelihood of engaging in behaviors, nudges provide non-monetary and non-regulatory interventions where behavior is gently influenced (Halpern, 2015). This is a cost-effective method that ultimately maintains an individual’s freedom to choose his or her behavior.
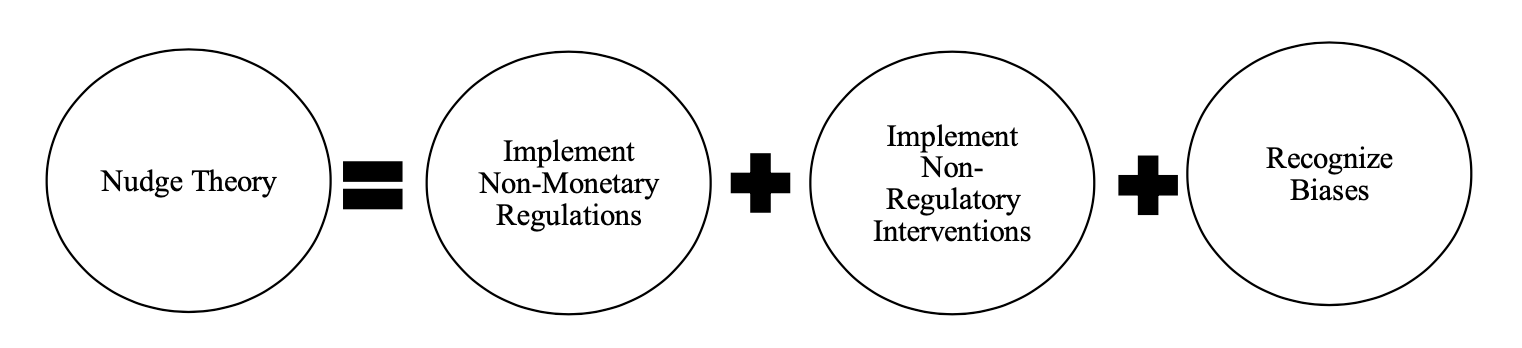
Primary Source: Halpern (2015)
Social cognitive theory seeks to explain people’s behavior through behavioral, environmental, and personal factors including the regulation of behavior through control and reinforcement in order to achieve goal-directed and long-term behavior change (Bandura, 1977, 1991). Additional aspects of the model are:
- Reciprocal determinism.
- Behavioral capability.
- Observational learning.
- Behavioral reinforcement.
- Expectations and consequences of behavior.
- Self-efficacy to perform behavior.
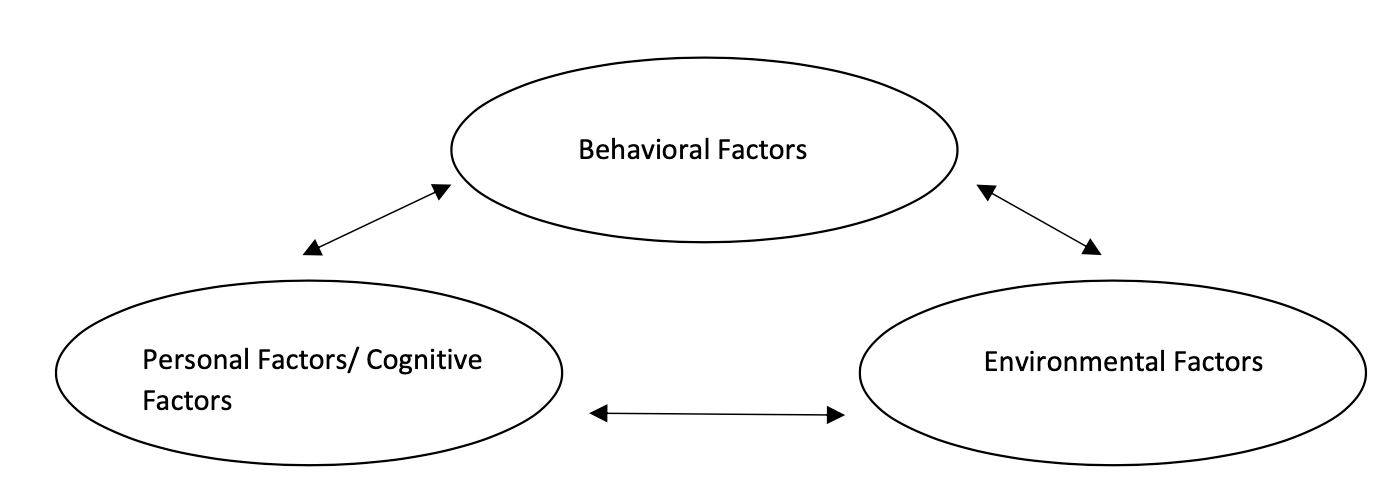
Primary Sources: Bandura (1977, 1991)
The health belief model presents a behavior change framework for understanding why individuals engage in healthy behaviors and how to promote the likelihood of engaging in healthy behaviors (Rosenstock, 1966). This framework comprises a person’s perceived susceptibility and severity to health-related problems, perceived self-efficacy, cues to action that influence behavior acceptance, and perceived benefits minus barriers (Janz & Becker, 1984). These variables will influence the likelihood of a person engaging in healthy behaviors.
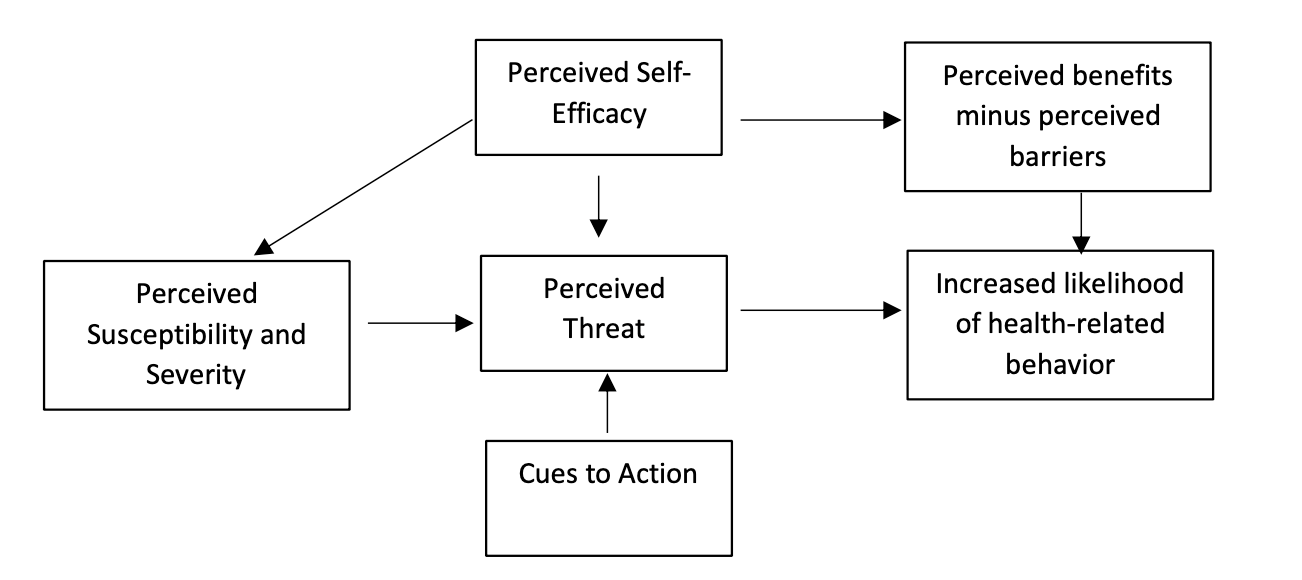
Primary Source: Rosenstock (1966)
The social-ecological model explains an individual’s behavior through five personal and environmental factors (McLeroy, Steckler, & Bibeau, 1988). Beginning at the individual level, a person’s knowledge, attitudes, and developmental history influence behavior. Each progressing level involves influence from larger domains of people, such as family, institutions, community, and public policy (McLeroy, Steckler, & Bibeau, 1988).
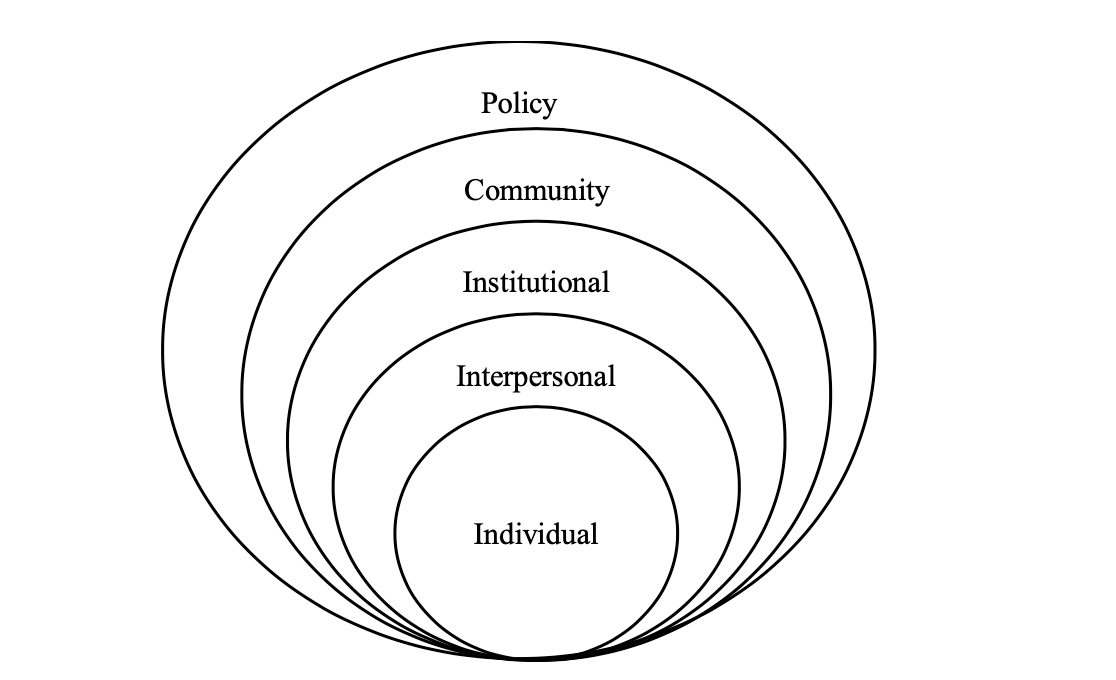
Primary Source: McLeroy, Steckler, & Bibeau (1988)
The transtheoretical model of change describes a six-step change process to an individual’s behavior (Prochaska & DiClemente, 1983). As shown, the six steps are:
- Precontemplation stage, where the individual is not yet ready to change.
- Contemplation stage, where the individual is getting ready to change.
- Preparation stage, where the individual is ready to change.
- Action stage, where behavior change is initiated.
- Maintenance stage, where behavior change is monitored.
- Termination stage, where old behavior is no longer present.
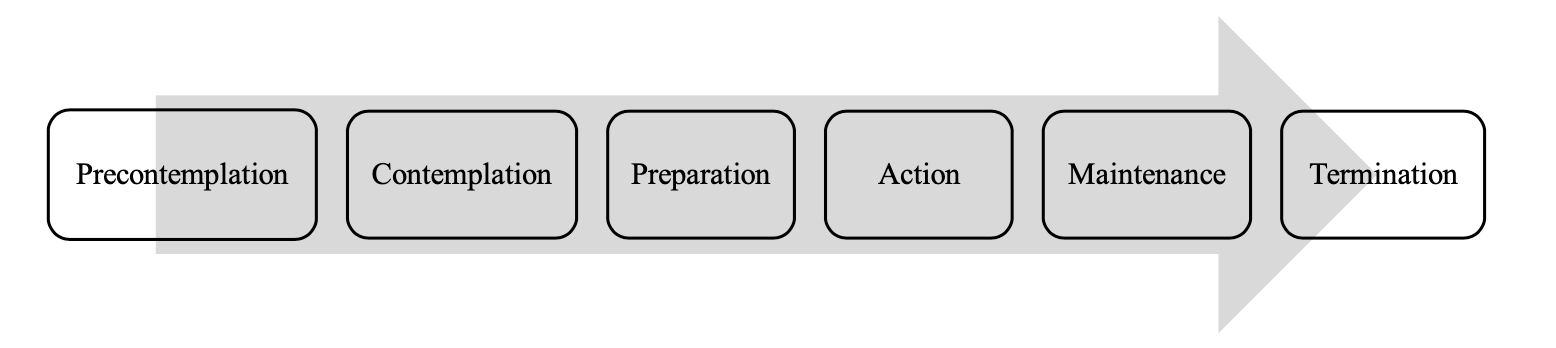
Primary Source: Prochaska & DiClemente (1983)
The workplace health model is a four-step process designed to improve employee health and safety in the workplace (Centers for Disease Control and Prevention, 2016). The model begins with a workplace health assessment, followed by program planning and management, and then implementation of the program. After implementation, program evaluation takes place to determine program outcomes (Centers for Disease Control and Prevention, 2016).
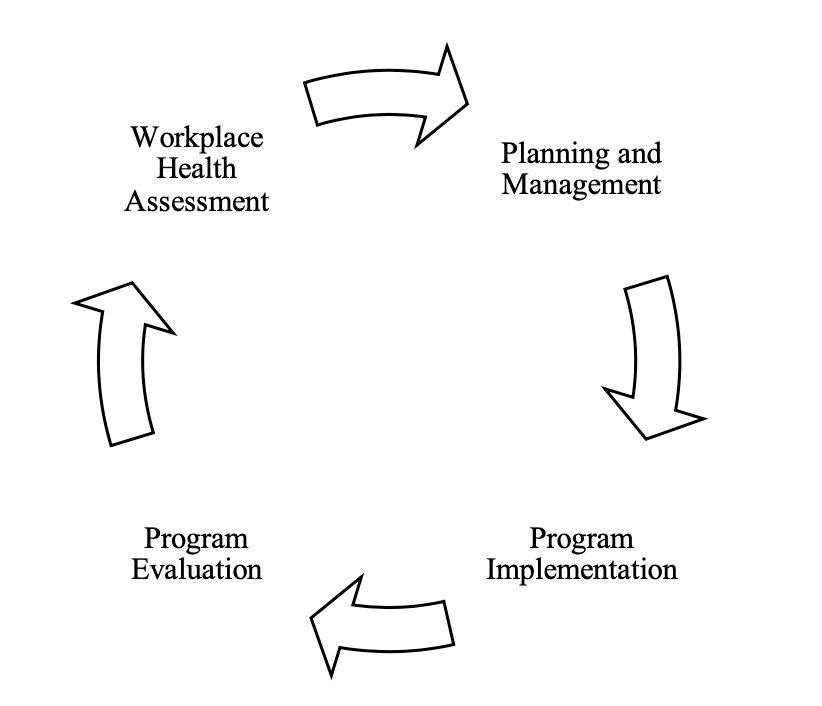
Primary Source: Centers for Disease Control and Prevention (2016)
The theory of planned behavior views behavior as a function of one’s behavioral intentions to participate in the behavior, which are shaped by attitudes toward the behavior, subjective norms, and perceived behavioral control. Attitudes refer to how favorably or unfavorably an individual perceives the behavior (Ajzen, 1985). Subjective norms refer to the social expectations regarding the behavior that a person perceives from influential others (Ajzen, 1985). Perceived behavioral control refers to someone’s perception of factors that limit and facilitate his or her engagement in a certain behavior (Ajzen, 1985).
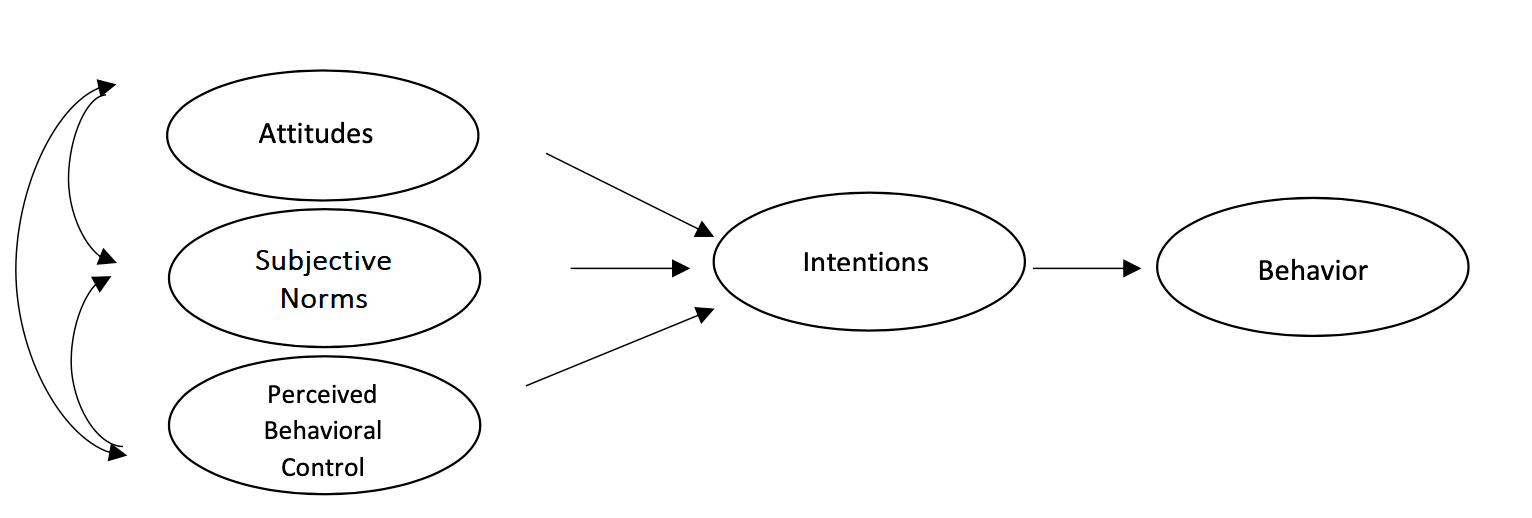
Primary Source: Ajzen (1985)
Theories at Work
What is your safety concern?
Driver Attitudes
Beliefs, Situational AwarenessDriver Behaviors
Safe Distances, Proper FlowDriver Health
Injuries, WeightDriver Knowledge
Hazards, Risk FactorsDriver Outcomes
CrashesOrganizational Outcomes
Safety ClimateSafety Program
Vehicle Operation
Idling, Time of MovementFilter within
Filter within Driver Attitudes
- Safety Culture
Filter within Driver Behaviors
- Defensive Driving
- Fatigue
- In-vehicle Monitoring
- Seat Belt Use
- Training
Filter within Driver Health
- Fatigue
- Injury
- Wellness
Filter within Driver Knowledge
- CDL
- Defensive Driving
- Hazardous Environments
- In-Vehicle Monitoring
- Peer Groups
- Risk Communication
- Specialized Vehicles
Filter within Driver Outcomes
- Braking
- Crashes
- Distraction
- In-Vehicle Monitoring
- Injury
- Metrics
- Seat Belt Use
- Speeding
Filter within Organizational Outcomes
- In-vehicle Monitoring
- Metrics
- Peer Groups
Filter within Safety Program
- Incentives
- Packaged Programs
- Peer Groups
- Program Design
- Program Development
- Program Implementation
- Program Selection
- Risk Communication
- Training
Filter within Vehicle Operation
- Braking
- CDL
- Metrics
- Speeding
- Training
An exploratory investigation into safety climate and work-related driving.
Industry: OtherTopic Area
Safety climate, work-related driving
Theory
Reciprocal Determinism Theory Theory of Planned Behavior
Study Design
Nonexperimental (survey)
Sample Size
323 employees who drive at work
Location
Queensland, Australia
Time Period
N/A
Key Variables
Traffic offenses, accident involvement, safety climate
Statistical Approach
Regression analysis
Summary: Wills et al. (2009) examined the effects of safety climate on motor vehicle fleet safety for 323 driving employees. The authors used a model informed by the frameworks of Bandura’s reciprocal determinism theory and the theory of planned behavior (1991). Using survey data collected from drivers, the authors conducted regression analysis and found that safety climate significantly predicted current and future driving behavior, as well as accounted for 10 percent of the variance in current work-related driver behavior (β = 0.20, p < 0.001). Driver attitudes were the strongest predictor of future driving intentions, accounting for 8 percent of the variance (β = 0.30, p < 0.001). Study results confirm the importance of safety climate in the driving safety domain and provide a theoretical framework to aid employers in their understanding of effective ways to target driver behavior and intentions through safety climate, person-related factors, and organizational factors.
A comparison between Swedish and Nigerian taxi drivers.
Industry: OtherTopic Area
Taxi drivers
Theory
Theory of Planned Behavior
Study Design
Nonexperimental (survey)
Sample Size
37 Swedish drivers, 28 Nigerian drivers
Location
Sweden, Nigeria
Time Period
N/A
Key Variables
Traffic climate factors, past experiences, attitudes, subjective norms, behavioral intentions, perceived behavioral control
Statistical Approach
Means t-test
Summary: Warner et al. (2007) sought an in-depth understanding of Nigerian and Swedish taxi drivers. They developed a survey based on the theory of planned behavior, which found that Nigerian taxi drivers had less driver training and had older cars compared to Swedish taxi drivers. Nigerian drivers viewed behaviors such as speeding and driving with bad tires more negatively than Swedish drivers (t = −5.57, p < 0.001 and t = −5.84, p < 0.001, respectively); however, 42 percent of the Nigerian drivers did not know the speed limit in urban areas, 21 percent did not know the speed limit in rural areas, and 18 percent reported not being able to see any patterning on their tires that would indicate a tire in poor condition. The findings indicate that more research needs to be done in low- and middle-income countries compared to high-income countries, but the findings also demonstrate how the theory of planned behavior can be used in the field.
The independence of independents: Influences on commercial driver intentions to commit unsafe acts.
Industry: UnknownTopic Area
Independent owner-operator truckers
Theory
Theory of Planned Behavior
Study Design
Nonexperimental (survey)
Sample Size
281 truck drivers
Location
United States
Time Period
N/A
Key Variables
Driver intentions, perceived behavioral control, safety climate perceptions
Statistical Approach
Structural equation modeling
Summary: Swartz and Douglas (2009) conducted a study examining the influence of corporate culture on independent owner-operator truckers. Using a survey based on the theory of planned behavior, perceptions of carrier safety climate were examined in relation to driver intentions to drive safely. Results indicated that driver attitudes and perceptions of behavioral control had the biggest influence on intentions to engage in risky driving behavior. The authors also reported that, contrary to expectations, driver perceptions of organizational safety climate had very little effect on driver intentions. However, supportive management practices were related to driver intentions to drive safely (−0.17, p < 0.10), while directive practices were not. This study indicates that the best way to promote safe driving behavior among owner-operators is through driver intentions and perceived behavioral control, but that organizational safety climate may not provide sufficient means to accomplish this.
Influence of public enlightenment programmes of the Federal Road Safety Commission on commercial drivers’ behavior in urban centres in Southwestern, Nigeria (Doctoral dissertation).
Industry:Topic Area
Public enlightenment programs
Theory
Theory of Planned Behavior
Study Design
Nonexperimental (survey and focus groups)
Sample Size
1,564 (survey); 72 (focus groups)
Location
Nigeria
Time Period
N/A
Key Variables
Driver intentions, driver behaviors
Statistical Approach
Multiple regression analysis
Summary: Sunmola (2014) sought to evaluate the effects of the Federal Road Safety Commission (FRSC) Public Enlightenment Programs (PEPs) on commercial driver behavior in Nigeria. The author used the theory of planned behavior as a framework to explain changes in driver behavior, and multiple regression analysis to examine the variance in driver behavior explained by PEPs. Effects of PEPs through radio, motor park rallies, road safety lectures, television, videos and films, posters, and billboards were reported. Results showed that PEPs through radio, motor park rallies, and road safety lectures positively influenced the behavior of Nigerian commercial drivers (F(5,392) = 519.531, r = .932, R2 = .869, Adj. R2 = .867, p < .05). In addition, the author reported that PEPs accounted for 86.7 percent of the variance in commercial driver behavior and that there is a need to continue implementing PEPs in Nigeria to influence safe driving behavior.
Rushing ruins livelihoods: Road safety in the taxi industry.
Industry:Topic Area
Safety—general, taxi driver crashes
Theory
Theory of Planned Behavior
Study Design
Nonexperimental (survey)
Sample Size
43 taxi drivers
Location
Queensland
Time Period
N/A
Key Variables
Driving behaviors, crashes, violations
Statistical Approach
Regression analysis
Summary: Stewart et al. (2005) used the Queensland Taxi Driver Questionnaire, which is based on the theory of planned behavior, to determine the causes of taxi driver crashes and explore suitable intervention strategies to reduce driver crashes. This pilot study was based on 43 Australian taxi drivers; upon data analysis, the questionnaire was revised and re-administered to a larger population of drivers. Results of that analysis indicated that speeding on residential streets was predictive of driver crashes (r = 0.50, p < 0.01). In addition, drivers who were more concerned with getting their passengers to their destination by a specific time frame, without considering road rules, were more likely to crash (r = 0.38, p < 0.05). Using these results, Vigil Systems modified a magnetic pen-operated computer to reflect driver behavior from this study and made plans to use the pen on additional populations of taxi drivers.
Improving safety during work-related driving among postal van drivers.
Industry:Topic Area
Safety—general
Theory
Lewin's 3-step Change Theory
Study Design
3 experimental groups; pre- and post-test design
Sample Size
N/A
Location
Finland
Time Period
2 years
Key Variables
Reduction in work-related crashes, reduction in fuel consumption
Statistical Approach
Descriptive statistics, chi-square
Summary: Salminen (2013) outlined several examples of earlier studies where Lewin’s three-step change theory was applied through group discussions at organizations, including populations of professional drivers. The present study compared three different methods to influence the driving behavior of Finnish postal van drivers. Following Lewin’s stages, the first method involved an initial meeting where drivers defined the problems associated with work-related traffic, a second meeting to discuss possible solutions to the problems, and a third meeting where drivers made decisions regarding behavioral changes. The second method was an improved discussion group, which differed from the first in that a one-day course was provided to drivers that covered company targets, as well as the problems and solutions previously identified by the drivers. The third method involved a defensive driving course with three hours of lectures and four hours of applied driving training. Results two years after interventions indicated that the improved discussion group was the only intervention that reduced work-related crashes (−67 percent), but the discussion group and improved discussion group resulted in reduced fuel consumption (−14 percent and −2.8 percent, respectively).
Two interventions for the prevention of work-related road accidents.
Industry:Topic Area
Work-related road safety
Theory
Lewin’s discussion
Study Design
2 experimental groups; pre- and post-test design
Sample Size
351 drivers
Location
Helsinki, Finland
Time Period
6 years (1st company); 3 years (second company)
Key Variables
Traffic-related work accidents, costs, benefits
Statistical Approach
Descriptive statistics, chi-square of audit results
Summary: Salminen (2008) outlined two employer-based interventions aimed at improving the safe driving behavior of electricians at two different companies. The first intervention program utilized discussions. A total of 183 driving issues were identified during the first meeting, 594 suggestions were made during the second, and drivers ultimately made 53 commitments to change their driving behavior during the third meeting. The author reported a 72 percent reduction in traffic accidents over an eight-year period during and after the intervention. In the second organizational intervention, a three-hour lecture and a five-hour training period were provided to drivers over the course of a single day. Drivers in the second organization responded positively to the training program and claimed to be using what they learned. Further, audits of work-related traffic risks before and six months after the training program showed a significant change (χ2 = 6.4, df = 1, p < .05). In conclusion, these interventions are potentially useful for occupational drivers, even drivers whose previous driver training is limited to the training they received while obtaining their driver’s licenses.
Implementation of a driving diary intervention to reduce aberrant driving behaviours.
Industry:Topic Area
Driving diary, driver attitudes and behaviors
Theory
Transtheoretical Model of Behavior Change
Study Design
1 experimental group; pre- and post-test design
Sample Size
24 taxi drivers (completed whole program)
Location
Queensland, Australia
Time Period
10 days
Key Variables
Self-reported attitudes and behaviors
Statistical Approach
Factor analytics procedures with alpha coefficients, descriptive analysis, correlation analysis
Summary: Rowland et al. (2009) conducted a study on taxi drivers’ self-reported attitudes and driving behaviors. Pre-intervention surveys using four measurement tools [i.e., Driver Behavior Questionnaire (DBQ), Data Acquisition (DAQ), Social Communication Questionnaire (SCQ) and Driver Perception of Pressure (DPP)] were administered to 182 Australian taxi drivers to provide baseline measures on driver attitudes and behaviors. The driving diary program was then provided to drivers based on the transtheoretical model of behavior change, where drivers recorded the type and frequency of traffic violations and then reflected and commented on their behavior. The transtheoretical model suggests that when drivers reflect on their behavior, they will see the risks associated with their driving and will work toward changing that behavior. Upon completion of the diary, the same survey was administered again as a post-intervention survey to determine if the driving diary had an influence on driver attitudes and behaviors. Results indicated that drivers who completed the diary reported safer attitudes and behaviors, especially when the diary was used alongside further training, such as a driver training workshop.
Design, development, and evaluation of driver wellness programs: Technical memorandum number two: Survey analysis and core program design.
Industry:Topic Area
Truck and bus driver wellness programs
Theory
Transtheoretical Model of Behavior Change
Study Design
Nonexperimental (survey)
Sample Size
448 truck and bus drivers
Location
United States
Time Period
N/A
Key Variables
Health concerns, health beliefs, health behaviors, health knowledge, program delivery preferences
Statistical Approach
Descriptive statistics, 2-sample t-tests
Summary: Roberts and York (1998) provided a summary and analysis of a truck and bus driver wellness program. The development of this program is a product of Task 2 of a five-task project to design, develop, and evaluate a truck and bus driver wellness program. A survey completed by 448 truck and bus drivers collected data on demographics and job descriptions as well as a range of health-related concerns, beliefs, behaviors, and preferences for the delivery of a health program. The survey found that long-haul truck drivers and drivers between 40 and 60 expressed the most concern about health issues (p = 0.002 and p = 0.000, respectively). Based on the survey results and a wellness literature and program review (completed in the previous task), a comprehensive wellness program was proposed. One of the main components of the proposed program is the utilization of the transtheoretical model of change to incorporate individualized strategies during the recruitment, introduction, and action phases of the wellness program. The fourth proposed stage involves an evaluation component where testing that was done in the introductory phase is repeated.
Prediction of safe driving behaviours based on health belief model: The case of taxi drivers in Bandar Abbas, Iran.
Industry:Topic Area
Safety—general
Theory
Health Belief Model
Study Design
Nonexperimental (survey)
Sample Size
184 taxi drivers
Location
Bandar Abbas, Iran
Time Period
N/A
Key Variables
Perceived susceptibility, perceived severity, perceived benefits, perceived barriers, self-efficacy, cues to action, self-reported behaviors
Statistical Approach
Correlation between HBM constructs and behaviors; Pearson’s correlation coefficient
Summary: Razmara et al. (2018) collected self-reported information on driver demographics, attitudes, beliefs, and driving behaviors from 184 taxi drivers in Bandar Abbas, Iran, using a questionnaire based on components of the health belief model (HBM). The questionnaire included questions about participants’ perceived susceptibility to crashing, perceived severity of crash consequences, perceived benefits of driving safely, perceived barriers to safe driving, self-efficacy (i.e., participants’ ability to drive safely), cues to action (factors such as the presence of police that influence driving safety), and self-reported frequency of specific safe driving behaviors. The questionnaire’s results indicated that cues to action and perceived benefits of safe driving were positively correlated to safe driving behaviors (0.38, p < 0.05 and 0.37, p < 0.05, respectively), while perceived barriers to safe driving were negatively correlated to safe driving behaviors (−0.31, p < 0.05). These results were used to make recommendations for elements to include in safe driving programs.
Effects of alertness management training on sleepiness among long-haul truck drivers: A randomized controlled trial.
Industry:Topic Area
Fatigued driving
Theory
Transtheoretical Model of Behavior Change
Study Design
1 experimental group, 1 control group; pre- and post-test design
Sample Size
53 truck drivers
Location
Finland
Time Period
~1 year
Key Variables
Self-reported driver sleepiness, prior sleep, use of sleepiness countermeasures
Statistical Approach
Multilevel regression
Summary: Pylkkönen et al. (2018) collected self-report data on driver sleepiness, prior sleep, and the use of sleepiness countermeasures before and after an educational intervention for a group of 53 truck drivers in Finland. Drivers in the intervention group received a three-and-a-half hour alertness management training session, followed by a two-month consultation period where trainers contacted drivers to ask if they had any questions related to their training. The Readiness to Change Questionnaire was used to assess driver stages of change based on the transtheoretical model at the beginning of training, two months afterward, and before the consultation period. The control group did not receive training or consultation, but they did maintain access to their occupational health services. Results of regression analysis indicated that the education intervention was not an effective remedy for driver sleepiness.
A new health promotion model for lone workers: Results of the safety and health involvement for truckers (SHIFT) pilot study; Competition, computers, and coaching: Three C’s for more effective health and safety promotion with truck drivers.
Industry:Topic Area
Safety—general, occupant protection, speeding
Theory
Transtheoretical Model of Behavior Change
Study Design
1 experimental group; pre- and post-test design
Sample Size
29 truck drivers
Location
United States, Pacific Northwest region
Time Period
6 months
Key Variables
Reductions in weight/BMI, decrease in dietary sugar/fat consumption, increase in exercise, decrease in speeding and hard braking
Statistical Approach
Descriptive statistics, t-test
Summary: Olson et al. (2009a) and Olson et al. (2009b) tested an approach to promote healthy behaviors among truck drivers using interventions that included computer-based training, a weight loss competition, behavioral self-monitoring, and motivational interviewing. Pre- and post-intervention measures included safe driving behaviors as recorded by onboard computer, health assessments, work/health history data (crashes, injuries, moving violations, illnesses, medications), and self-reported health and safety climate perceptions collected via survey. Results indicated that 75 percent of participants who completed the post-intervention assessment showed statistically and clinically significant weight loss (average 7.8 lb (ΔSD = 11.5, Δd = 0.68, P = 0.005), significant reductions in BMI (average change of −0.96, ΔSD = 1.49, Δd = 0.64, P < 0.01), and significant reductions in hard braking (average reduction of 0.61 per 10,000 miles, ΔSD = 0.70, Δd = 0.88, P = 0.02).
Safety in occupational driving: Development of a driver behavior scale for the workplace context; Occupational driver safety: Conceptualising a leadership-based intervention to improve safe driving performance.
Industry:Topic Area
Work-related driving
Theory
Hockey’s Cognitive-Energetical Model
Study Design
Nonexperimental (survey)
Sample Size
145 executive-level drivers, 645 community-based nurses, 248 community-based nurses
Location
Australia
Time Period
N/A
Key Variables
Intentions to speed, anticipated regret for speeding, driver attitudes, subjective norms, perceived behavioral control
Statistical Approach
Hierarchical regression
Summary: Newnam et al. (2011) and Newnam et al. (2012) developed a scale of occupational driver behaviors based on Hockey’s cognitive energetical model and focused on identifying unsafe driving behaviors that (a) occur with particular frequency in work-related driving and (b) that may be related to work overload. Hockey’s model assumes that individuals will make strategic and behavioral decisions that enable them to reach their highest-priority goals, which in a work-related context, may lead to prioritizing their organization’s goal of on-time arrival over certain safe driving behaviors. Speeding, traffic law violations, inattention, and driving while fatigued were identified as problematic driving behaviors that were likely to be influenced by overwork conditions. The developed Occupational Driver Behavioral Questionnaire (ODBQ) included questions about drivers’ frequency of engaging in these behaviors, questions intended to measure drivers’ perceptions of occupational workload, and a question about the number of kilometers driven per week. Results from an initial survey of 145 occupational drivers reduced the number of scale items from 15 to 12. A second survey of 645 drivers confirmed the scale’s factor structure, reliability, and construct validity; results from this survey indicated a strong relationship between workload and inattention (r = 0.41, p < 0.001), and between workload and driving while fatigued (r = 0.31, p < 0.001), while speeding and violations were less strongly associated with workload. A third survey of 248 drivers established criterion validity, comparing the relationships of the OBDQ-identified driving behavior with the general-driving DBQ. Results indicated moderate relationships between the OBDQ and DBQ for all four behaviors (speeding: r = 0.57, p < 0.001; violations: r = 0.49, p < 0.001; inattention: r = 0.37, p < 0.001; fatigue: r = 0.38, p < 0.001).
A participative education program to reduce speeding in a group of work-related drivers.
Industry:Topic Area
Speeding
Theory
Antecedent-Behavior-Consequences
Study Design
1 experimental group, 1 control group; pre- and post-test design
Sample Size
28 employees who drive at work
Location
Australia
Time Period
6 months
Key Variables
Self-reported speed, kilometers driven per week
Statistical Approach
Repeated measures analysis of variance
Summary: Newnam and Watson (2009) conducted an intervention based on participative education among work-related drivers based on the antecedent-behavior-consequences model. Those in the intervention group participated in a one-hour safety awareness session that utilized facilitated discussion and goal setting. Those in the intervention group had statistically significant reduced speeding during the six-month period (p = 0.018), while those in the control had a nonsignificant increase in speeding during the same period.
Safety in work vehicles: A multilevel study linking safety values and individual predictors to work-related driving crashes.
Industry:Topic Area
Safety—general
Theory
Theory of Planned Behavior
Study Design
Nonexperimental (survey)
Sample Size
385 drivers, 88 supervisors, 52 fleet managers
Location
Australia
Time Period
N/A
Key Variables
Driver attitudes and self-efficacy, supervisor and fleet manager safety values
Statistical Approach
Multilevel modeling
Summary: Newnam et al. (2008) surveyed 385 fleet drivers, 88 supervisors, and 52 fleet managers from six Australian government agencies to evaluate how their safety climate perceptions influenced motivation to drive safely. Based on the theory of planned behavior, drivers’ self-efficacy and attitudes toward safe driving were used as predictors of motivation. Using multilevel modeling, the authors reported individual motivation as a significant predictor of work-related crashes (ϴ = −0.747, t = −2.20, p < 0.05), and that drivers were more motivated to drive safely when they perceived that their supervisor and fleet managers valued safety. The multilevel modeling techniques also revealed that safety values at the fleet manager level were related to safety values at the driver level (ɣ = 0.09, p < 0.05), meaning safety values could be transmitted across organizational levels.
Using psychological frameworks to inform the evaluation of fleet safety initiatives.
Industry:Topic Area
Safety—general
Theory
Behavioral Modification Framework Elaboration Likelihood Model Persuasive Communication Framework
Study Design
Nonexperimental (survey)
Sample Size
24 fleet managers
Location
Australia
Time Period
N/A
Key Variables
Attention, comprehension, acceptance, credibility, perceived purpose of countermeasures
Statistical Approach
Bivariate correlations
Summary: Newnam et al. (2006) surveyed 24 fleet managers to evaluate two driver safety initiatives in terms of each initiative’s effect on attitudinal change, and to examine whether any changes were consistent with social psychological frameworks (the persuasive communication framework and the behavioral modification framework). The study found that an outreach campaign communicated via newsletter to fleet managers achieved the greatest attitude change (r = 0.61, p < 0.001) if the managers believed the information had direct relevance to their fleets and businesses, a finding consistent with a persuasive communication framework. The incentive program, however, was not shown to significantly change attitudes toward safety among the participating fleet managers.
Factors predicting intentions to speed in a work and personal vehicle.
Industry:Topic Area
Speeding
Theory
Theory of Planned Behavior
Study Design
Nonexperimental (survey)
Sample Size
204 drivers
Location
Australia
Time Period
N/A
Key Variables
Intentions to speed, anticipated regret for speeding, driver attitudes, subjective norms, perceived behavioral control
Statistical Approach
Hierarchical regression
Summary: Newman et al. (2004) evaluated the psychological processes influencing intentions to speed in a personal vehicle compared to a work vehicle using 204 drivers from four organizations. Drivers received a questionnaire with a variety of questions related to driver attitudes and behaviors in both personal and work vehicles. Using the theory of planned behavior and anticipated regret for speeding as an evaluation framework, anticipated regret for speeding and subjective norms explained why drivers had lower intentions to speed in a work vehicle compared to a personal vehicle, which was contrary to the authors’ prediction. Attitudes toward speeding, specifically anticipated regret following speeding, differed across organizations (F (3,198) = 2.77, p < 0.05, α2 = 0.04); anticipated regret was more frequently reported by drivers from an organization with more stringent safety practices for work-related driving. These results revealed the unique aspects of driving company-owned vehicles for work purposes, compared to personal vehicles for non-work purposes and the implications therein.
Work-related road safety: A case study of Roche Australia.
Industry:Topic Area
Organizational case study, driver safety program at Roche
Theory
Haddon Matrix
Study Design
1 experimental group; pre- and post-test design
Sample Size
422 drivers
Location
Australia
Time Period
5 years
Key Variables
Average number of vehicles, insurance claims, overall claims ratio, reductions by claim type
Statistical Approach
Linear modeling
Summary: Murray et al. (2012) provided a case study of a work-related road safety program at the Australian pharmaceutical company, Roche. The organization utilized the framework of the Haddon matrix, which emphasizes driver, vehicle, and journey management factors. The specific steps of the program involved an online driver risk assessment and improvement program, policy development and communications program, evaluation based on process and outcome variables, and last, continuous refinement of the program using benchmark data. Roche Australia reported that, as a result of the program, the insurance claims per fleet vehicle decreased from 36 percent to 28 percent, with a 55 percent decrease in overall vehicle damage costs between 2004 and 2009. Statistical analysis showed that total claims decreased by an average of 9.7/year (p = 0.01, R2 = 84 percent).
Effective occupational road safety programs: A case study of Wolseley.
Industry:Topic Area
Employer-based driver safety program
Theory
Haddon Matrix WIPE model
Study Design
1 experimental group
Sample Size
N/A
Location
United Kingdom
Time Period
4 years
Key Variables
Annual crash statistics
Statistical Approach
Descriptive statistics
Summary: Murray et al. (2009) provided a program overview of the driver safety program at Wolseley, the world’s largest plumbing and heating distributor. This organization incorporated the WIPE (Why, Initial, Pilot, and Evaluation) and Haddon matrix fleet safety models into a process utilizing the following four stages: (1) why focus on fleet safety; (2) initial and continuous status review; (3) pilot, implement, and change management countermeasures; and (4) evaluation. After a four-year period of implementation, it was reported that although vehicle fleet size doubled, the proportion of vehicles involved in third-party collisions each year decreased from 65 percent to 35 percent. This translated into a reduction of about 1,000 vehicle crashes per year during each of the four years of program evaluation. The authors concluded that this case study provides a model for implementing an effective research-based driver safety program.
Driving fatigue in professional drivers: A survey of truck and taxi drivers.
Industry:Topic Area
Fatigued driving
Theory
Theory of Planned Behavior
Study Design
Nonexperimental (survey)
Sample Size
274 truck drivers, 286 taxi drivers
Location
Beijing, China
Time Period
N/A
Key Variables
Fatigue experience, accident information, attitude toward fatigue, fatigue management strategies
Statistical Approach
Descriptive statistics, logistic regression, t-tests, chi-square tests
Summary: Meng et al. (2015) sampled 274 truck drivers and 286 taxi drivers to evaluate the fatigue management strategies and fatigue education of professional drivers in Beijing. Different questionnaires were created and administered to each of the driver populations, but most questions were identical for comparison between truck and taxi drivers and were based on the theory of planned behavior. Responses indicated that truck and taxi drivers experienced and responded differently to fatigue; taxi drivers reported experiencing fatigue “often” or “always” 59.5 percent of the time, compared with 38 percent of truck drivers (χ2 = 25.8, P < 0.001). Additionally, truck drivers who had been in one or more crashes in the previous year identified fatigue as a factor in five out of 31 total crashes (16.1 percent), while crash-involved taxi drivers identified fatigue as a factor in 22 out of 73 crashes (30.1 percent). While prolonged driving was common in both groups, most drivers felt that fatigue driving was more serious for other drivers than for themselves. Additionally, taxi driver fatigue countermeasures tended to occur simultaneously with driving, while truck drivers were more prone to counteract fatigue by stopping. Overall, results show the unique approaches to fatigue in the taxi driver population compared to the truck driver population.
Development and evaluation of the Work-Related Road Safety CD-ROM.
Industry:Topic Area
Work-related road safety
Theory
Transtheoretical Model of Behavior Change
Study Design
1 experimental group; pre- and post-test design
Sample Size
37 organizations
Location
United Kingdom
Time Period
16 months
Key Variables
Quantitative: pre- and post-assessment responses to questionnaires including attitudes, behaviors, knowledge of policies and procedures, knowledge of WRRS-related facts, perception of WRRS management; Qualitative: content analysis of interview responses
Statistical Approach
Analyses of variance, proportions, chi-square tests
Summary: Lang et al. (2009) provided a report on the effectiveness of a guidance-based CD-ROM at improving work-related road safety (WRRS) in 37 organizations in the United Kingdom, with 405 driver questionnaires and 107 manager questionnaires being completed. The results presented focused on organizations rather than individuals. Overall, organizations rated the CD-ROM highly and reported that driver management procedures were improved. The tool allowed organizations to assess their driver safety system based on the transtheoretical model of change and move to the next stage of change. Many organizations reported moving from the contemplation or preparation stage into the action or maintenance stage of change. Other organizations simply used the tool to evaluate the comprehensiveness of their system and make small adjustments accordingly. Results were evaluated using Kirkpatrick’s framework. In addition to positive reactions to the CD-ROM (Level 1), improvements were reported in the areas of attitudes, driver and manager knowledge (Level 2), and self-reported driving behavior (Level 3). An evaluation of driver accidents (Level 4) proved difficult to assess and was determined to be an unreliable outcome variable; thus, no significant changes took place. Senior management's commitment to WRRS and availability of resources were critical components of a successful road safety program.
Driving locus of control and driving behaviors: Inducing change through driver training.
Industry:Topic Area
Driving behaviors, driver training
Theory
Social Learning Theory
Study Design
1 experimental group; pre- and post-test design
Sample Size
112 driver trainees
Location
Midwest United States
Time Period
5 weeks
Key Variables
Change scores for driver locus of control measures, safe driving behaviors, self-efficacy, and motivation to learn
Statistical Approach
Descriptive statistics and intercorrelations between variables; paired-sample t-tests
Summary: Huang and Ford (2012) conducted a study with 112 trainees during a defensive driving course that consisted of two classroom sessions (two hours each) to train drivers on how to avoid potentially dangerous driving situations. Drivers also completed a predetermined driving route where driving behaviors were recorded by a trained observer before and after the classroom training sessions, and drivers were provided with observer feedback. The authors used the framework of social learning theory to assess driver locus of control before and after the classroom training to understand how changes in driver locus of control can influence driving safely. Study results indicated that drivers, post-training, reported significant decreases in external locus of control (t = −3.56, p < 0.001, d = −0.34) and significant increases in internal locus of control (t = 8.15, p < 0.001, d = 0.80). These changes to external and internal locus of control predicted an increase in safe driving behaviors (β = −0.28, p < 0.01 and β = 0.20, p = 0.03, respectively). This study indicates that influencing driver locus of control through training and feedback can effectively lead to safer driving behaviors.
Road safety improvement in large companies. An experimental comparison of different measures.
Industry:Topic Area
Safety—general
Theory
Lewin's 3-step Change Theory Theory of Reasoned Action
Study Design
4 experimental groups, 1 control group; pre- and post-assessment with within-group and between-group comparisons
Sample Size
4,656 drivers
Location
Sweden
Time Period
2 years
Key Variables
Accident risk per 10,000 km, accident cost
Statistical Approach
Risk ratios
Summary: Gregersen et al. (1996) compared accidents per mile-traveled and accident costs for five groups of drivers (900 to 988 drivers per group, for a total of 4,656 drivers) employed by a Swedish telephone company. Drivers in four of the groups experienced one of four countermeasures intended to reduce crash risk: specialized driver training, group discussions, outreach campaigns, and bonuses for accident-free driving. The fifth group was a control group that did not receive any of the four countermeasures. During the two years following the test groups’ participation in the countermeasures, accident costs were reduced among all test groups, with the largest cost reduction (from SEK800/10,000 km to SEK300/10,000 km) seen within the group that received the group-discussion countermeasure; costs were not significantly reduced in the control group. Accidents per mile-traveled were significantly reduced (at a 95 percent confidence level) for the drivers who received the specialized driver training (risk ratios of 1.67 before/after and 1.59 control/training), the group discussions (risk ratios of 2.26 before/after and 1.79 control/group discussions), and to a lesser extent, the bonuses (risk ratios of 1.31 before/after and 1.35 control/bonuses). No reductions in accidents per mile were seen in the campaign group or the control group during the same two-year period.
Promoting safety belt use at industrial sites: An effective program for blue-collar employees.
Industry:Topic Area
Seatbelt use
Theory
Lewin's 3-step Change Theory
Study Design
2 experimental groups; pre- and post-test design
Sample Size
1,025 employee who drive at work
Location
Virginia
Time Period
N/A
Key Variables
General regulatory attitudes, perceived regulatory effectiveness, perceived effectiveness of regulatory enforcement, perceived reasonableness of the regulations
Statistical Approach
Descriptive statistics, t-tests
Summary: Geller and Hahn (1984) compared the effects of a seatbelt incentive program for blue-collar and white-collar employees at two different plants. The seatbelt program used by both plants involved incentivizing seatbelt use, but one plant also utilized awareness sessions for blue-collar workers. The plant without awareness sessions reported that seatbelt use doubled (from 6.0 percent to 13.4 percent; t(39) = 12.6, p < 0.001) among blue-collar workers during the incentive period, while the plant with both incentives and awareness sessions saw an increase in seatbelt use from 6.7 percent to 20.9 percent (t(29) = 14.2, p < 0.001) following the awareness sessions and to 41.7 percent (t(50) = 23.1, p < 0.001) during the incentive program. Although seatbelt use significantly decreased (from 13.4 percent to 7.9 percent for the incentive-only plant, and from 41.7 percent to 26.8 percent for the awareness-plus-incentive plant) after the incentive programs were removed, the authors proposed that this study showed how education and incentive programs can improve seatbelt use for blue-collar workers, a population that was formerly not receptive to safety-belt programs.
A multi-dimensional construct of commercial motor vehicle operators’ attitudes toward safety regulations.
Industry:Topic Area
Safety regulations
Theory
Theory of Planned Behavior
Study Design
Nonexperimental (survey scale development)
Sample Size
432 drivers
Location
Texas
Time Period
N/A
Key Variables
General regulatory attitudes, perceived regulatory effectiveness, perceived effectiveness of regulatory enforcement, perceived reasonableness of the regulations
Statistical Approach
Item/factor analysis
Summary: Douglas and Swartz (2009) developed a scale to assess truck drivers’ attitudes toward regulations based on the theory of planned behavior. The scale was developed using an iterative process that included pilot tests with four independent samples of truck drivers (totaling 432 completed responses over the four iterations), each followed by modifications to scale items as needed. The results of the study indicated that the final version of the scale would produce valid and reliable results.
Improving safety behavior and accident rates of professional drivers: The Dead Sea project.
Industry:Topic Area
Safety—general
Theory
Social Learning Theory Theory of Cognitive Dissonance
Study Design
1 experimental group; pre-and post-test design
Sample Size
48 drivers
Location
Israel
Time Period
8 months
Key Variables
Number of crashes, observed behaviors including seatbelt use, speeding behavior, indicating before turning
Statistical Approach
Chi-square analysis, descriptive statistics
Summary: Calé (2012) tested a two-stage workplace driving safety program with 60 truck drivers from a single company. In Stage 1 of the program, participating employees performed a computerized driving skills test, followed by an in-vehicle driving test, before receiving feedback about their driving capabilities and suggestions for improving their driving performance and safety. In Stage 2, participants were trained and motivated to promote driver safety within their company by joining the program’s community service action group, media action group, or prizes and reinforcement action group. The 48 participants who completed both stages of the program demonstrated dramatic improvements in driving behaviors including wearing seatbelts (“no one in vehicle is belted” changed from 91.4 percent of observed behaviors pre-intervention to 49.8 percent of observed behaviors post-intervention) and signaling correctly (from 15.8 percent of observed behaviors pre-intervention to 39.2 percent post-intervention), and the company’s overall crash rate (included crashes for all employees not stratified by participant status) decreased by a third during the four years following the project.
Safety culture and work-related road accidents.
Industry:Topic Area
Driver attitudes, employee driver crashes
Theory
Theory of Planned Behavior
Study Design
Nonexperimental (surveys and interviews)
Sample Size
283 (survey); 84 (interview)
Location
United Kingdom
Time Period
N/A
Key Variables
Survey: safety culture perceptions (using the Health and Safety Climate Tool); Interview: demographic information, compliance with company rules/regs, attitudes to driving violations, work pressures, safety management; Accident/company data: crashes, near-misses, insurance claims, driver mileage per year
Statistical Approach
Qualitative analyses, descriptive statistics
Summary: Bomel Ltd. (2004) provided a report that outlined the relationship between organizational safety culture and driver attitudes to employee driver behavior and organizational accident liability. A total of 283 company car and heavy goods vehicle drivers from seven companies were surveyed to measure safety culture and driver attitudes using the theory of planned behavior as a framework, and then responses were compared to company crash data. In addition to the survey, 56 of the heavy goods vehicle drivers and 28 of the company car drivers were interviewed to assess driver experience, company rules, and various driver attitudes, such as attitudes toward violations, pressure, fatigue, and organizational safety management practices. The authors reported that although company accident data were lacking in both breadth and depth, a moderate relationship emerged between driver attitudes and company accident rates. Specifically, positive driver attitudes were related to low company accident rates.
Stages of change in the Australian workplace and its application to driver education.
Industry:Topic Area
Employee road safety behavior change, stages of change
Theory
Transtheoretical Model of Behavior Change
Study Design
Nonexperimental (interviews)
Sample Size
5 drivers, 5 managers
Location
Australia
Time Period
N/A
Key Variables
Themes and patterns associated with stages of change
Statistical Approach
Qualitative analyses
Summary: Banks et al. (2008) used the transtheoretical model of change as a framework for understanding employee readiness for road safety behavioral change. Based on interviews with 10 employees from two organizations, it was determined that fleet managers and drivers are not always aligned in their current stage of change. The first organization consisted of managers operating in the preparation and action stages, while employees were in the precontemplation stage. Alternatively, the second organization’s managers and employees were all operating out of the maintenance stage. The authors proposed that the results of this study imply that organizations should implement a stage-based approach to safety planning to minimize driver resistance. The structure and content of driver education and training should reflect the degree that drivers and employees are aligned in change readiness.
A study of virtual simulation in a truck driver training program (Master’s thesis).
Industry:Topic Area
Driver simulation training, safe driving skills
Theory
Social Cognitive Theory
Study Design
1 experimental group; pre- and post-test design
Sample Size
142 drivers
Location
Wisconsin
Time Period
8 weeks (survey questions); 1 year (fuel and crash data)
Key Variables
Confidence levels, fuel consumption, driver accidents, and costs
Statistical Approach
Descriptive statistics, two-tailed z-test
Summary: Anibas (2008) evaluated an eight-week truck driving training program at Chippewa Valley Technical College by studying 142 drivers before and after a virtual driving simulator was added to the course. The author presented a brief review of the literature and indicated that driver simulators have the potential to increase trainee self-efficacy based on social cognitive theory. Participants in the simulator and non-simulator training groups completed surveys based on confidence levels, fuel records of the trucks used in training were reported, and accident records based on body shop estimates were collected. An analysis of pre- and post-test results indicated that the driving simulator was effective in increasing trainee confidence levels for the following driving maneuvers (p < 0.05): backing into a loading dock, setting up for a backing maneuver, using a 13-gear shifter, downshifting, stopping at an intersection, setting up for a right turn, setting up for a left turn, turning at a busy intersection with a stop sign, turning at a busy intersection with a traffic light, and changing lanes on a four-way highway. Improvements were also seen in factors including a 30 percent reduction in fuel consumption from pre- to post-training and a reduction in driver accidents from four in the year pre-training to none in the year after training.
How to train safe drivers: Setting up and evaluating a fatigue training program.
Industry:Topic Area
Fatigued driving
Theory
Theory of Planned Behavior
Study Design
1 experimental group; pre-and post-test design
Sample Size
162 drivers
Location
Greece
Time Period
2 months
Key Variables
Knowledge about fatigue causes and solutions, behavioral beliefs, risk comprehension, behavioral intentions, control beliefs, descriptive norms, past behavior, self-reported behavior
Statistical Approach
Non-parametric testing (chi-square test for homogeneity, Wilcoxon signed-rank test), bivariate correlations, linear regression analyses
Summary: Adamos and Nathanail (2015) evaluated a training program for professional drivers that raised awareness of the risk that fatigue poses to driver safety and encouraged them to take a rest break from driving rather than other solutions (e.g., coffee, smoking). The training program consisted of a two-hour lecture followed by a group discussion with a total of 162 professional drivers who were all employees of a building materials company in eight cities in Greece. Participants completed questionnaires before the training and two months after the training, answering questions about their knowledge of fatigue’s risks and effective solutions, their behavioral beliefs around dealing with fatigue while driving, their intended behaviors pertaining to fatigue when driving, norms around fatigue and driving among their colleagues, and past behaviors pertaining to fatigue and driving. Linear regression analysis of the response variables found that descriptive norm was the strongest predictor within a model predicting self-reported stopping and resting (R2 = 0.1, p < 0.05), while behavioral beliefs, behavioral intention, and past behavior were the strongest predictors of a model predicting use of other fatigue solutions (R2 = 0.69, p < 0.01).
Cluster modeling of driving behavior under fatigue.
Industry:Topic Area
Fatigued driving
Theory
Health Belief Model
Study Design
Nonexperimental (pre-during-post-test design)
Sample Size
Nonexperimental (pre-during-post-test design)
Location
Greece
Time Period
7.5 months
Key Variables
Self-reported risk comprehension, behavioral beliefs, past behaviors, intentions, and current/future behaviors
Statistical Approach
Linear regression analyses
Summary: Adamos et al. (2014) developed models to predict the effects of an outreach campaign on the dangers of fatigued driving on driver behavior. Drivers were surveyed before, during, and after a fatigued driving outreach campaign was implemented regarding their behavioral beliefs, risk comprehension, behavioral intentions, and past and current behaviors pertaining to fatigue when driving. The analysis focused on developing prediction models to assess the impact on driving behavior of a road safety communication campaign on fatigue. The results found that behavioral beliefs and risk comprehension were weak predictors of intentions and behaviors. In addition, past behavior could predict intentions, and past behavior and intentions could predict behavior.
Do road safety communication campaigns work? How to assess the impact of a national fatigue campaign on driving behavior.
Industry:Topic Area
Fatigued driving
Theory
Health Belief Model
Study Design
1 experimental group; pre-during-post-test design
Sample Size
996 total: 500 nonprofessional drivers, 496 professional drivers
Location
Greece
Time Period
7.5 months
Key Variables
Number of respondents who had seen/heard of campaign, awareness of campaign theme and message, appreciation/satisfaction with campaign, message takeaway, knowledge about fatigue risks, behavioral beliefs, risk comprehension, behavioral intentions, past behavior, self-reported behavior
Statistical Approach
Non-parametric testing (chi-square test for homogeneity, Kruskal-Wallis U test, Mann-Whitney U test)
Summary: Adamos et al. (2013) developed an evaluation methodology for an outreach campaign that was designed to raise awareness of the risks of driver fatigue and to encourage professional and nonprofessional drivers to stop and rest when feeling fatigued. The results showed that an average of 13 percent of drivers were reached within the campaign’s target area and that the most effective communication channel was the distribution of campaign leaflets. Statistically significant increases in positive survey responses were observed on numerous variables, including awareness of the most effective countermeasure for driver fatigue driving and drivers’ likelihood of reporting that they stopped and rested when fatigued.
A before-after study of the impact of a road safety training program on professional drivers
Industry:Topic Area
Fatigued driving
Theory
Theory of Planned Behavior
Study Design
1 experimental group; pre- and post-test design
Sample Size
162 drivers
Location
Greece
Time Period
2 months
Key Variables
Knowledge about fatigue causes and solutions, behavioral beliefs, risk comprehension, behavioral intentions, control beliefs, descriptive norms, past behavior, self-reported behavior
Statistical Approach
Non-parametric testing (chi-square test for homogeneity, Wilcoxon signed-rank test, Mann-Whitney U test)
Summary: Adamos and Nathanail (2017) assessed the impact of a fatigue-based driving training program for 162 professional drivers in Greece. The training program consisted of knowledge of effective countermeasures for fatigue, persuading drivers to avoid ineffective solutions, increasing risk perceptions, and increasing intentions to take short breaks. Evaluation of the training program was structured around the theory of planned behavior through pre- and post-intervention questionnaires. The authors reported that the training program was effective at significantly increasing drivers’ self-reported behavior of stopping to rest when fatigued (r = −0.17, p = 0.004) and significantly decreasing self-reported use of ineffective strategies (coffee drinking: r = −0.24, p = 0; listening to music: r = −0.22, p = 0; opening the window: r = −0.26, p = 0).