5.0 Climate Change Effects
5.1 Potential Climate Change Effects to Consider
5.2 Tools and Methods for Planning/Programmatic Assessment of Climate Change Effects
5.3 Tools and Methods for Project-level Assessment of Climate Change Effects
5.4 Equity Considerations
5.5 Communicating Findings and Drawing Conclusions
5.6 Mitigation Measures
5.7 Examples in Practice
5.1 Potential Climate Change Effects to Consider
Project-level climate change effects include impacts to the completed project, such as more frequent or severe inundation and damage caused by sea level rise or coastal flooding. Climate change effects also include a project’s potential impact on the human and natural environments to the degree that climate change may exacerbate these effects. Considering these effects can help to build resilience into the project design, increase the project’s ability to withstand climate change effects, and mitigate the project’s effects on the environment, contributing to the resilience of shared systems. Since evidence suggests that climate change will not impact all people and communities equally, it is particularly important to consider how certain groups may experience a greater or lesser burden when considering any potential climate change effects related to a transportation project.
Climate change effects related to a project could include:
- What are the relevant climate change effects for transportation planners to consider in project development?
- How can programmatic assessments of climate change effects inform project-level evaluation?
- What tools, methods, and data sources can be used to evaluate climate change effects, including effects on equity-focus communities?
- What mitigation measures can be implemented to minimize the impacts of climate change on a project or the project’s effects on the environment related to climate change, including effects on equity-focus communities?
- What are some examples of how agencies have addressed these questions in different contexts?
Potential climate change effects should be identified as early as possible in the project development process, and ideally prior to the start of a National Environmental Policy Act (NEPA) assessment, to best incorporate design alternatives that address climate change effects. Statewide climate plans, where available, generally identify climate change effects at a high level but may provide sufficient detail to identify the scope of climate change effects to be considered in a particular project. Climate change effects for particular areas will vary based on regional changes in temperature, precipitation, weather patterns, extreme weather events, and other factors. To the greatest extent possible, the effects climate change could have on the project should be identified. Multiple sources of information are often available on how climate change may affect the environment within the state or even a more specific project area. The sections below detail some state-specific examples of where information on climate change effects can be obtained, as well as resources that are national in scope.
5.1.1 Federal Guidance on Climate Change Effects
The interim 2023 Council on Environmental Quality (CEQ) guidance indicated that agencies should consider climate change’s effects on the environment and on proposed actions in assessing vulnerabilities and resilience to the effects of climate change (CEQ 2023a). These effects may include (but are not limited to) heat waves, longer fire seasons and more severe wildfires, degraded air quality, increased drought, greater sea level rise, an increase in the intensity and frequency of extreme weather events, harm to water resources, harm to agriculture, ocean acidification, and harm to wildlife and ecosystems.
The CEQ guidance advises agencies to provide sufficient information to consider siting issues; the initial project design; consistency with existing state, Tribal, and local adaptation plans; reasonable alternatives with preferable overall environmental outcomes and improved resilience; and potential mitigation measures. Agencies should integrate the NEPA review process with the agency’s planning, siting, and design efforts at the earliest possible time that would allow for a meaningful analysis. Agencies may also consider co-benefits of the proposed action, alternatives, and potential mitigation measures. The agency should indicate whether the proposed action includes measures to adapt to climate change and, if so, describe those measures and the climate projections that informed them.
In addition, agencies should consider whether the effects of climate change in association with the effects of the proposed action may result in disproportionately high and adverse effects on communities with environmental justice concerns. Agencies should identify any communities with environmental justice concerns, including communities of color, low-income communities, and Tribal Nations and Indigenous communities that are impacted by the proposed action, and consider how impacts from the proposed action could potentially amplify climate change-related hazards such as storm surge, heat waves, drought, flooding, and sea level change. Agencies should meaningfully engage with affected communities regarding their proposed actions and consider the effects of climate change on vulnerable communities in designing the action or selection of alternatives.
5.1.2 State Guidance on Climate Change Effects
As discussed in Section 3.3, some states identify potential climate effects on a project-by-project basis for projects warranting an Environmental Assessment (EA) or Environmental Impact Statement (EIS). This is consistent with other environmental effects considered under NEPA. Attempts to conduct a more programmatic approach can be seen in process innovations such as Planning and Environmental Linkages analyses and merger agreements between state departments of transportation (DOTs) and environmental agencies to coordinate permitting required under NEPA and the Clean Water Act. As of 2023, several states were in the process of revisiting their approach to handling climate change effects in environmental review documents through new state-specific guidance.
In addition to crafting new guidance, an emerging practice is for state agencies, including DOTs, to establish climate-focused offices. Climate-focused offices can serve as a useful repository of information on potential localized, project-specific climate change effects to be considered for a particular location. For example, one of the goals of the Delaware DOT’s Transportation Resilience and Sustainability (TRS) Program is to examine the impacts climate change and sea-level rise are having on the state’s transportation infrastructure and to incorporate resiliency and sustainability measures in the planning, designing, construction, and maintenance of projects. The TRS also fosters relationships with other agencies and organizations that house relevant data and can be partners in identifying potential alternatives, such as the Delaware Department of Natural Resources and Environmental Control, Federal Highway Administration (FHWA), MPOs, advocacy organizations, and coalitions.[1]
Many states have conducted their own assessments of expected climate change effects within their borders. Some of these assessments have been carried out through state climate offices or multi-sectoral statewide climate adaptation planning efforts. Other states have developed transportation-specific vulnerability assessments and adaptation plans, and some have developed guidance specifically for integrating climate change effects in NEPA or state “mini-NEPA” environmental review processes. An example of the type of guidance typically found in statewide plans is included in the New Hampshire DOT’s (NHDOT) Potential Impacts of Climate Change on Transportation Infrastructure (New Hampshire DOT 2014), which provides guidance on climate change effects that are likely to affect assets managed by NHDOT. These impacts are mapped to programs within the state, such as the Bridge Rehab & Replacement Program, Emergency Transportation Planning, and Project Development. This guidance includes an overview of climate change effects, impacts, affected assets, and outcomes associated with these effects (Table 5‑1).
Table 5-1. NHDOT Climate Change Variables and Expected Impact on NHDOT Assets
| Climate Change Inputs | Impact of Climate Variable | Affected NHDOT Asset | Expected Results/Increases From Climate Change | |
| Extreme Precipitation Events | • Increased intensity & amount of rainfall • Increased stormwater runoff • Wind damage | • Culverts, drainage systems, or stormwater facilities • Roads • Bridges • Road signs • Stream or riverbank stabilizations | • Culvert damage (Capacity exceedances, ice/snow blockages, frequent repair or replacement) • Road/bridge repair • Bridge scouring • Erosion and sedimentation • Increase in maintenance • Flooding • Washouts (roads, culverts, bridges) | • Risk of accidents • Power outages • Traffic delays • Fallen trees (along or across roadways) |
| Sea-level Rise & Storm Surge | • Wind damage • Increased sea-levels • Increasing storm surge encroachment | • Culverts,drainage systems, or stormwater facilities • Roads • Bridges • Road signs • Sea walls | • Property damage • Delays and traffic re-routing • Transportation infrastructure damage (roads, bridges, sea walls, culverts, guardrails) • Flooding / washouts | |
| Warming Winters | • Additional stormwater runoff into drainage areas (winter) • Timing: Earlier peak stream flows. • Reduced extent of snowpack • Ice treatment for roads/bridges • Increased freeze/thaw events | • Roads • Bridges • Undersized culverts, drainage systems, or stormwater facilities | • Culvert damage (ice dams and flooding) • Increase in road maintenance/repair • More treatment for ice on roads/bridges • Increased risk of accidents • Increase in frost heaves & potholes • Longer growing season (increased roadside maintenance • Potential increased road salt use | |
| Temperature | • Increased average temperatures • Increased maximum summer temperatures • Heat waves | • Roads • Bridges • Light control boxes | • Longer growing season (vegetation management, mowing, construction) • Rescheduling maintenance crews (summer) • Potential for pavement rutting/buckling | |
WSDOT’s guidance on addressing climate effects in NEPA and State Environmental Policy Act (SEPA) includes climate change effects of concern to transportation infrastructure (Table 5‑2) and directs users to the University of Washington’s Climate Impacts Group, which develops state-specific climate information, including anticipated climate changes in the Pacific Northwest. The Climate Impacts Group’s Climate Impacts in Brief summarizes some of the key climate change effects associated with different phases of region-specific variability (UW 2022).
Table 5-2. WSDOT Potential Climate Change Effects
| Projected Climate Change | Potential Impacts on State Highways, Rails, and Ferries |
|
|
|
|
|
|
5.1.3 Other Resources
In addition to the resources developed by states for identifying climate change effects, federal agencies and other organizations have developed tools, databases, and other resources that can assist transportation agencies across the U.S. in understanding how climate change may affect the natural and human environment. The National Climate Assessment (NCA), which is mandated every four years, is a multi-agency effort that analyzes current trends and projects future trends in climate change, and analyzes the effects of climate change across multiple sectors, including transportation. In addition to NCA Volume II, Chapter 12, which focuses on transportation, the NCA includes individual chapters that describe climate change effects observed and anticipated in 10 distinct geographic regions of the United States (USGCRP 2018). The NCA provides a useful resource for understanding climate change effects and trends at a high level and larger spatial scales.
U.S. DOT’s Transportation Climate Change Sensitivity Matrix[2] (U.S. DOT 2015) is an Excel-based tool that allows users to understand the sensitivity of 11 transportation asset classes to particular climate stressors, which allows users to screen for assets that are particularly vulnerable to climate change effects. Users can select assets and climate stressors (Figure 5‑1) and review the connection between climate change effects and impacts on physical infrastructure, service, access, maintenance, and operations.
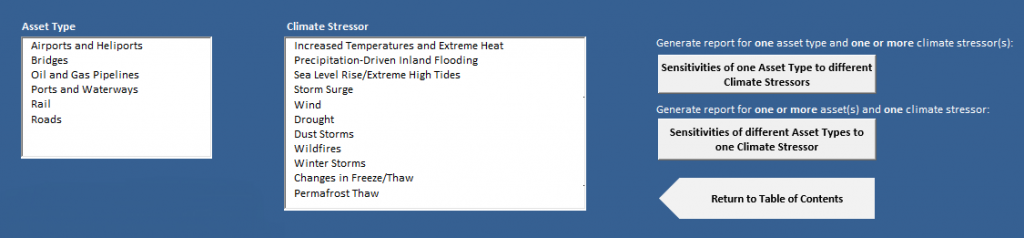
Source: U.S. DOT (2015)
The U.S. EPA’s website on climate change includes information about EPA’s reports on climate change (U.S. EPA 2022). Climate change effects are summarized into six categories (Table 5‑3). For each effect, the agency website explains what the effect is, describes national trends, links to data, and provides technical documentation. Not all of these effects will be relevant to transportation project evaluation.
Table 5-3. U.S. EPA Climate Indicators
| Greenhouse Gases | Weather and Climate | Oceans | Snow and Ice | Health and Society | Ecosystems |
|
|
|
|
|
|
Other resources are useful for identifying examples of how transportation agencies are integrating adaptation and resilience into their plans and projects or for helping agencies walk through adaptation processes to integrate the consideration of climate change effects in their decisions. For example, the Georgetown Climate Center’s Adaptation Clearinghouse includes a Transportation Sector page that allows users to find examples of adaptation in different stages of transportation decision-making, including vulnerability assessments, planning, environmental review, project design and design guidelines, and operations and maintenance strategies. The U.S. Climate Resilience Toolkit provides a five-step process, beginning with identifying climate change effects that are important to the community and understanding the community’s priorities (USGCRP 2022). Identifying climate change effects can be done using a checklist of common weather and climate-related hazards, linking those hazards to assets, and, where a potential climate risk is identified, proceeding to conduct a vulnerability assessment.
5.2 Tools and Methods for Planning/Programmatic Assessment of Climate Change Effects
Evaluating climate change effects at the project level is likely to result in an analysis that focuses on mitigating climate change effects through design changes. Such an analysis, while useful for identifying those mitigation measures, may overlook opportunities to build in resilience at a system level. If possible, environmental review of climate change effects should follow from a programmatic assessment of climate change effects, as a programmatic approach can develop a better understanding of climate change effects of importance to local communities and identify alternatives that may support greater system-wide resilience to climate change effects. The CEQ emphasized the importance of such an approach in the interim 2023 guidance (CEQ 2023a), pointing out that some risks may best be identified early in the process in order to avoid certain climate-related effects. Programmatic approaches for DOTs to consider climate change effects may include:
- Vulnerability and risk assessments for transportation infrastructure.
- Development of a Resilience Improvement Plan, as encouraged under the Promoting Resilient Operations for Transformative, Efficient, and Cost-Saving Transportation (PROTECT) program of the Infrastructure Investment and Jobs Act of 2021, to include a risk-based assessment of transportation vulnerabilities, and immediate and long-range planning activities and investments to systematically improve surface transportation resilience.
- Assessments of how transportation systems and plans may exacerbate or help mitigate impacts of climate change on the human and natural environments, such as by increasing or decreasing habitat connectivity or impermeable surface area.
- Revisions to design manuals, engineering instructions, and other documents to systematically prepare projects for the effects of climate change and/or mitigate climate change-related impacts of a project on the built and natural environment.
Sidebar 5-1: Support for Programmatic Assessment
The interim CEQ guidance emphasizes the importance of a planning/programmatic assessment:
Decades of NEPA practice have shown that integrating environmental considerations with the planning process provides useful information that program and project planners can consider in the design of the proposed action, alternatives, and potential mitigation measures. For instance, agencies should take into account increased risks associated with development in floodplains, avoiding such development wherever there is a practicable alternative.
— CEQ (2023a)FHWA’s Vulnerability Assessment and Adaptation Framework, 3rd edition (FHWA 2017) provides a framework for assessing climate change effects at a programmatic level, with specific steps for an in-depth and structured process. This assessment includes an iterative process by which key climate change effects and impacted assets are identified, objectives are identified, vulnerability is assessed, and climate change effects are integrated into decision-making (Figure 5‑2). This framework is useful for communicating that vulnerability and risk assessment is a process that should be revisited and repeated as science and data improve and as the built environment changes.
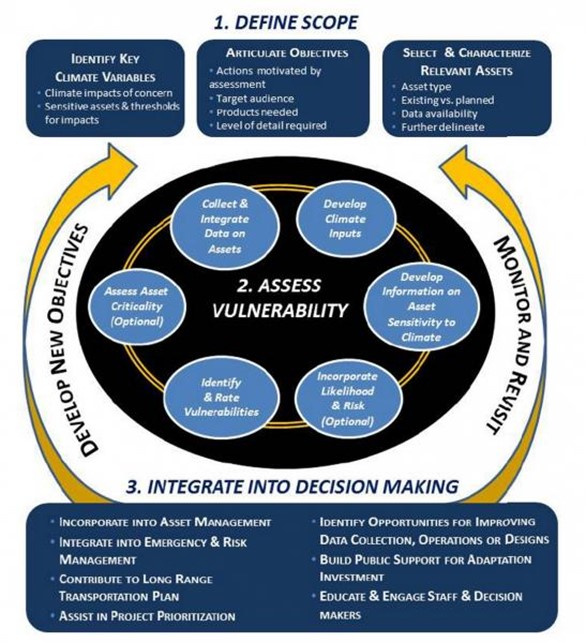
Source: FHWA (2017c)
WSDOT’s Climate Impacts Vulnerability Assessment provides a framework for a qualitative assessment of risks that identifies areas of high potential climate impact, areas that could experience temporary operational impacts at one or more locations, and areas that could experience reduced capacity. This assessment includes an inventory of department-owned assets and climate change data. Areas with higher impact are generally located in the mountains, above or below steep slopes, in low-lying areas subject to flooding, along rivers that are aggrading due to melting glaciers, and in low-lying coastal areas subject to inundation from sea level rise. The criticality of different classes of assets is scaled using a score from 1 to 10 (Figure 5‑3).
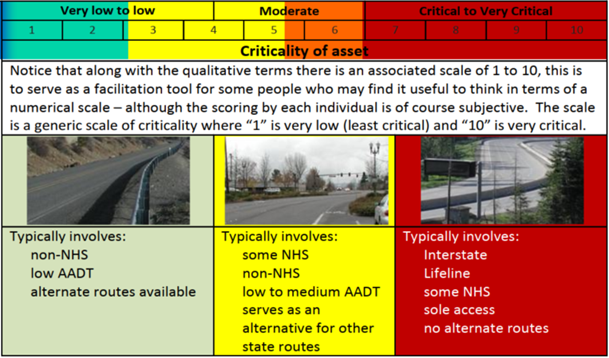
Washington State DOT (2011)
Sidebar 5-2 provides an additional example of how a regional planning agency, the Puget Sound Regional Council, has developed an interactive hazards map that can be used to assess vulnerability.
Sidebar 5-2: Case Study on the Puget Sound Regional Council Interactive Regional Hazards Map
The Puget Sound Regional Council (PSRC) has developed an interactive hazards map to show which areas of King, Kitsap, Pierce, and Snohomish counties are vulnerable to various hazards, including many climate change effects (Figure 5‑4). This tool could be used during project screening and scoping to identify potential areas of vulnerability to climate change effects.
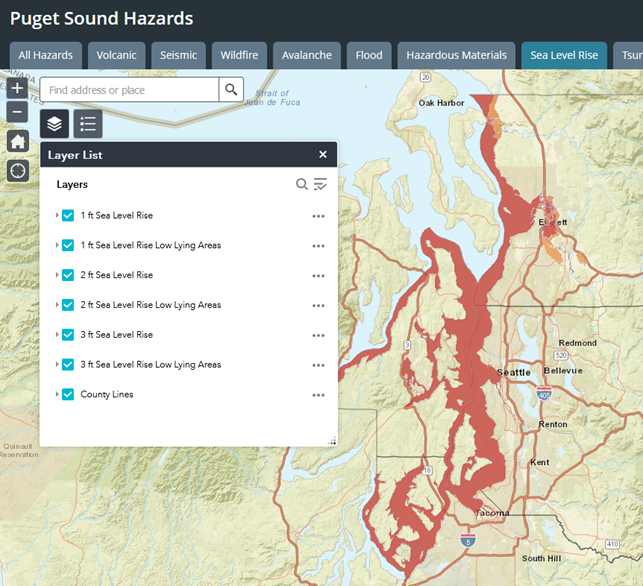
Source: Puget Sound Regional Council
5.3 Tools and Methods for Project-Level Assessment of Climate Change Effects
Project-level assessment of climate change effects most often focuses on the vulnerability of the project to climate change (e.g., potential for damage or disruption due to flooding, storm surge, or extreme heat). Climate change effects also include a project’s potential impact on the human and natural environments, which may be exacerbated due to the effects of climate change on the environment.
An asset’s vulnerability to climate change effects is a function of its exposure, sensitivity, and adaptive capacity.
Different levels of assessment may be warranted based on the proposed project’s vulnerability to particular climate change effects. For some projects, such as those advanced through the environmental process under a CE, limited levels of exposure may not suggest the need for a project-level assessment.
A few states have developed guidance to support a vulnerability and resilience assessment at the project level. An example from Washington State is shown in Sidebar 5-3:
Sidebar 5-3: Washington State Guidance for NEPA and SEPA Project-Level Climate Change Evaluations
Washington State DOT (2022) provides guidance to project teams to ask and answer: “How will my project be affected by climate change? What are ways to increase the resilience of the transportation assets in the project area?” These steps, generalized slightly here, are as follows:
- Examine the results of WSDOT’s 2011 Climate Impacts Vulnerability Assessment for your project area (Washington State DOT 2011). This information will alert you to potential vulnerabilities and/or strengths in the existing WSDOT facilities.
- Examine local and regional climate data. Project teams should determine whether there is regional or site-specific climate information that would be useful or applicable to their project’s resilience and the analysis of project-related impacts and mitigation. A list of regional, state, and federal climate information sources is included.
- Assess impacts. Direct project technical specialists to consider the available climate change information (steps 1 and 2) in their NEPA and SEPA analysis, including the future climate conditions as they relate to the success of suggested mitigation of project impacts. Specialists should consider and document their findings as to whether climate change will exacerbate the effects of the proposed project on: a. Vulnerable populations and overburdened communities as defined by statute. b. Environmental resources, including cultural resources, fish and wildlife habitat, and others as appropriate.
- Document findings in the NEPA EA or EIS. Document how the project will be designed to be resilient or resistant to climate threats (such as the use of drilled shafts or site selection to avoid a potential threat). Include consideration of ways to address vulnerability of environmental justice populations, transit-dependent populations, or residents with special transportation needs. Often the most logical place for this discussion is the cumulative effects section.
The WSDOT guidance explains how climate and extreme weather preparedness are considered in all program areas. Even in cases where a programmatic assessment has been completed, project sponsors may choose to complete a project-level assessment where the level of exposure to climate-related threats and hazards is expected to rise, or consequences of failure are particularly high. FHWA’s synthesis of recommendations and approaches in the Synthesis of Approaches for Addressing Resilience in Project Development (FHWA 2017a) highlights a challenge with using historical data to assess future impacts: namely, historical data may no longer be relied upon to accurately describe future changes over the life of the transportation asset. Figure 5‑5 shows a decision-making framework that can inform when project planners may choose to perform a project-level assessment of a proposed project. This framework was developed considering precipitation, sea level, storm surge, heat, drought, and wildfire. The synthesis addresses coastal hydraulics, riverine flooding, pavement and soils, and mechanical and electrical systems.
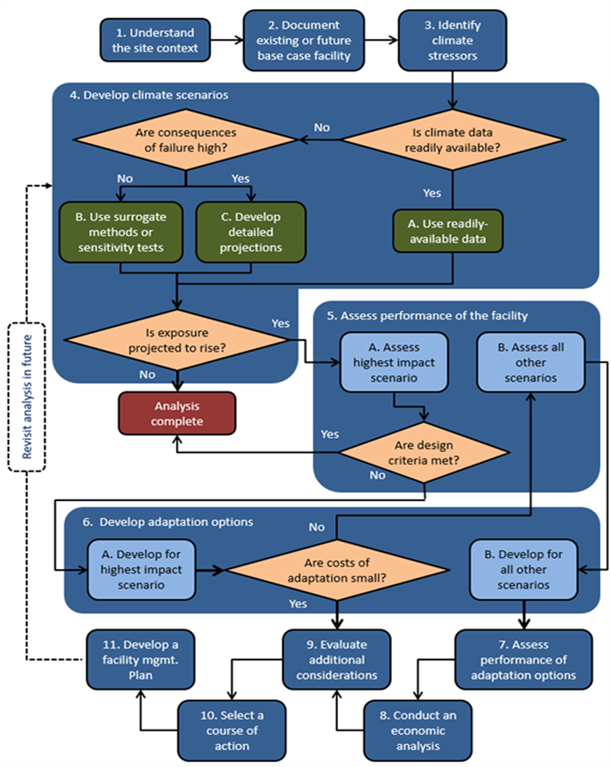
Source: FHWA (2019). Adaptation Decision-Making Assessment Process
Appendix B provides detailed information on tools that can be used to support a project-level evaluation of climate change effects. Table 5-4 provides a summary of the types of climate change effects covered in these tools. Some of the tools offer sophisticated modeling capabilities that can simulate changing hydrologic geologic processes, such as the Precipitation Runoff Modeling System. Others provide information on state-specific impacts, such as the Cal Adapt Climate Tools. The particular tool that can support the analysis may be informed by the level of exposure or potential risk to an asset.
Increasingly, a best practice for assessing impacts is to incorporate a life-cycle approach that considers climate change effects over time and the non-linear progression of many climate change effects. Some of the tools summarized in Appendix B incorporate these changing risks, and an increasing number of state guides recommend this approach. The FHWA Highway Engineering Circular HEC-25 (FHWA 2020) indicates that life cycle cost analysis incorporating Monte Carlo-like simulations and other techniques may be necessary to simulate different cumulative damage scenarios. Such analyses can incorporate many different management decisions and can account for changing conditions over time. This approach also supports incorporating economic valuations of different alternatives. Note that this approach also supports FHWA’s Asset Management Rule, which calls for state DOTs to include lifecycle planning in their asset management planning and to incorporate climate change, resiliency, and other factors that could affect an asset’s performance over its lifetime (FHWA 2016e).
FHWA has developed transportation-specific tools relevant to transportation planners that can be used to incorporate multiple climate effects and expected impacts on certain transportation assets. These are summarized on the FHWA Climate Change Adaptation Tools website and include:
- Coupled Model Intercomparison Project (CMIP) Climate Data Processing Tool (2018) – Spreadsheet tool that processes downscaled climate projects from the World Climate Research Program into relevant statistics for transportation planners. Climate effects include temperature, precipitation, and sea level rise.
- Sensitivity Matrix (2015) – Spreadsheet tool that documents the sensitivity of roads, bridges, airports, ports, pipelines, and rail to 11 climate impacts, including temperature and extreme heat, precipitation-driven inland flooding, sea level rise/extreme high tides, storm surge, wind, drought, dust storms, wildfire, winter storms, changes in freeze-thaw, and permafrost thaw.
- Vulnerability Assessment Scoring Tool (2019) – Spreadsheet tool that supports a quantitative assessment of assets to temperature change, precipitation change, sea level rise, storm surge, and wind.
Table 5-4. Climate Change Effects Covered in Key Resources
Unlike other topic areas, it is common for climate effects to be incorporated into many different resource topics within an environmental review document. For example, the climate effects associated with the river environment may be addressed in the hydrology section of an environmental review. Some long-established guidance documents, such as the Hydraulic Engineering Circulars, are expanding to incorporate likely climate effects (see Sidebar 5-4). While detailed hydraulic engineering is not likely to be completed at the time environmental documentation is complete, environmental documents can reference the intent to consider climate change information, such as projected precipitation and discharges consistent with one or more climate change scenarios, rather than simply relying upon historical data.
Sidebar 5-4: Climate Change Effects in Existing Tools
FHWA Hydraulic Engineering Circular No. 17, 2nd edition describes the suggested levels of analysis for performing risk and vulnerability assessments of riverine transportation infrastructure based on the best available methods available at the time (FHWA 2016f). This guidance can be tailored depending on the appropriate levels of analysis considering the risks for the project:
- Level 1 – Historical discharges. At level 1, the design team applies standard hydrologic design techniques based on historical data to estimate the design discharge. In addition, the design team qualitatively considers changes in the estimated design discharge based on possible future changes in land use and climate.
- Level 2 – Historical discharges/confidence limits. At level 2, the design team estimates the design discharge based on historical data and qualitatively considers future changes in land use and climate as in level 1. In addition, the design team quantitatively estimates a range of discharges (confidence limits) based on historical data to evaluate plan/project performance.
- Level 3 – Historical discharges/confidence limits with precipitation projections. At level 3, the design team performs all level 2 analyses and quantitatively estimates projected changes in precipitation for the project location. The design team evaluates the projected changes in precipitation to determine if a higher level of analysis is appropriate.
- Level 4 – Projected discharges/confidence limits. At level 4, the design team completes all level 3 analyses and develops projected land use and climate data where feasible. The design team performs hydrologic modeling using the projected land use and climate data to estimate projected design discharges and confidence limits.
- Level 5 – Projected discharges/confidence limits with expanded evaluation. At level 5, the design team performs the equivalent of the level 4 analyses based on custom projections of land use and climate. The design team also expands to include appropriate expertise in climate science and/or land use planning to secure site-specific custom projections.
5.4 Equity Considerations
5.4.1 Transportation Climate Change Effects and Equity
Equity is considered in environmental review according to federal requirements and guidance, as outlined in Section 3.2, to identify and address the disproportionately high adverse human health and environmental effects of their programs, policies, and activities on low-income and minority populations.
Climate change effects can impact equity-focus communities directly, indirectly, and cumulatively. A local community may be directly threatened or forced to move as a result of sea level rise, or indirectly threatened as increasing summer temperatures make traditional agricultural practices impossible or extreme heat more difficult to cope with. While some effects may be broadly related to global climate change and the incremental impacts of a project indiscernible, there also may be specific localized effects that are exacerbated or mitigated by the project, such as loss of transportation accessibility due to extreme weather events or changes in local hydrology.
The impacts of climate change will not be borne equally or fairly. Recent evidence suggests that climate change will most impact equity-focus communities including people of color, low-income households, undocumented migrants, individuals with lower levels of educational attainment, renters, women, unemployed persons, single-parent households, the elderly, the young, individuals who experience housing insecurity, individuals with disabilities, rural communities, resource-based communities (including agricultural workers, fishing communities, miners, and others), and American Indian and Alaska Native Tribes (Lynn, MacKendrick, and Donoghue 2011; Cutter et al. 2009; U.S. EPA 2021a).
In some cases, it may not be possible to directly measure impacts because there may not be an appropriate data source. For example, while certain air quality changes can be generally understood to have a connection to certain health outcomes, data may not be available to quantify the link between climate change, air quality, and health outcomes for a particular community. Similarly, because it may not be possible to measure impacts on religious or traditional beliefs (Ulibarri, Perez Figueroa, and Grant 2022), it may not be possible to quantify those impacts in a NEPA analysis, although they may be addressed qualitatively.
An equity analysis in the context of climate change, which might also be considered or termed a climate justice analysis, can explore where there are communities that may be disproportionately affected by climate change effects due to factors such as income or economic stability, access to transportation services, health, age, exposure to climate hazards, and access to transportation services – particularly where transportation projects or even planning efforts are under consideration.
5.4.2 Tools and Methods for Equity Analysis Related to Climate Change Effects
Screening tools can help agencies determine where disproportionately impacted communities might exist. Appendix B identifies tools that could support agencies and equity-focus communities in evaluating the potential climate change effects related to a proposed project.
In selecting a tool, key considerations include the vintage of the data within the tool, indicators included within the tool’s data, the level of geography supported, and the objectives for the assessment. Note that none of the tools discussed below are sufficient for identifying an environmental justice population consistent with the implementing guidance for Executive Order 12898, and they must be used in conjunction with data gathered from the U.S. Census.
Each of the tools can provide insight into specific questions of climate risk, vulnerability, and resilience. The tools are strongest for their ability to identify environmental risks through project development, from initial scoping through an analysis of effects. All of the tools have contributed to the analysis and mapping of climate risks, and share many commonalities as well as unique use cases. The discussion below focuses on the tools’ usefulness for analysts conducting an assessment under NEPA.
The most commonly used tools for identifying demographic information for NEPA assessments appear to be the American Association of State Highway Transportation Officials (AASHTO) Census Transportation Planning Products (CTPP) and the Census Bureau’s On the Map tool, which summarizes the Longitudinal Employer Households Dynamics Origin-Destination Employment Statistics (LODES). While the CTPP is built on American Community Survey (ACS) data and generally includes more detailed demographic information than the LODES data, the vintage of some of the data contained in the most recent release is more than 10 years old as of January 2023 (drawing on ACS data gathered starting in 2012). The LODES data uses administrative data drawn from the State Quarterly Census of Employment and Wages (QCEW), which has the advantage of providing a more recent and complete sample (approximately 95 percent of the total United States workforce) but with less demographic detail.
For questions about community capital, environmental resilience, and institutional resilience, the Federal Emergency Management Agency (FEMA) National Risk Index can be used to identify communities most at risk from 18 natural hazards. The dataset includes metrics on expected annual losses from natural hazards, social vulnerability, and community resilience. The National Risk Index incorporates both the University of South Carolina’s Baseline Resilience Indicators for Communities (BRIC), as well as the Social Vulnerability Index for the United States (SoVI), though those datasets are only available at the county level and the data vintage should be noted. An example of the type of available output from this analysis is shown in Figure 5-6.
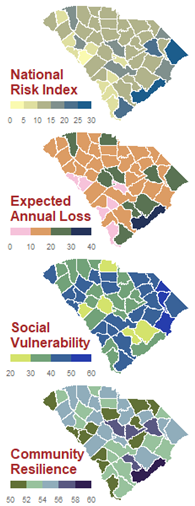
Source: FEMA
The Climate and Economic Justice Screening Tool (CEJST) can provide information on environmental factors, climate risk, and various community characteristics (including the built environment, economic characteristics, race/ethnicity, and transportation). This tool was developed by the CEQ in 2022 pursuant to EO 14008. The tool identifies communities that are “disadvantaged” based on more than 100 indicators, including a combination of climate and environmental indicators (e.g., expected agriculture loss rate, energy burden, traffic proximity and volume, exposure to air pollutants) and social indicators (income and access to education). The tool also provides detailed underlying data on each census tract’s score for each of those indicators. This tool was developed with wide collaboration, including nearly 3,000 public comments and active involvement from many organizations with subject matter expertise in specific topic areas. The tool also proactively treats certain variables to remove common ‘noise’ in certain indicators. For example, the presence of housing built prior to 1960 is often used as a proxy to indicate the likely presence of lead paint, but high-value housing built prior to 1960 has likely had lead-containing paint removed. The CEJST addresses much of this ‘noise’ by using calculated values; in the case of the lead paint indicator, the CEJST uses a calculated value that factors in both the percent of housing units built prior to 1960 and the median home value of owner-occupied units.
An overview of the available tools is included in Table 5-5.
Table 5-5. Equity Considerations Covered in Key Tools and Data Resources
Beyond data analysis, it is important to directly engage affected communities to understand the climate and weather effects they are experiencing and may experience in the future in ways that are meaningful to them. As Ulibarri et al. (2022) observe, “The public lacks the knowledge to translate their fears into specific quantifiable units that the agency can (or is allowed to) understand, the agency lacks the skill to facilitate a more mutually intelligible conversation, and both lack specific data (besides lived experience) that would point to the harm being present.”
Community engagement is required as part of an EIS completed under NEPA and encouraged as part of Environmental Assessment preparation. Agencies are required to provide meaningful opportunities for public participation in the NEPA process, particularly in the scoping process (when agencies decide on the range of issues to be addressed in the environmental review) and when the NEPA document is published for public review and comment (U.S. EPA undated). The Federal Interagency Working Group’s Promising Practices for EJ Methodologies in NEPA Reviews (EJIWG 2016) highlights the importance of both the method and the timing of that engagement, with the most successful engagement strategies incorporating innovative approaches to public outreach that begin from the outset of the NEPA process.
However, one of the barriers to meaningful engagement is the perception that decisions are often final by the time the NEPA process has been started. A criticism expressed by nongovernmental and community organizations contacted in the development of this guide, as well as in other recent research (Ulibarri, Perez Figueroa, and Grant 2022), is that public engagement during the NEPA process is too late to meaningfully influence the project’s outcomes.
A best practice for incorporating equity considerations into the analysis of greenhouse gas (GHG) emissions or climate change effects is to engage community members outside of the project development process, including during long-range planning and programming efforts. This may include a programmatic vulnerability assessment (see Section 5.2) or other practices consistent with a Planning and Environmental Linkages approach in which information developed in planning informs environmental review.
Example in Practice: Equity and Climate Change Analysis in the Corporate Average Fuel Economy Standards Model Years 2024-2026
The National Highway Traffic Safety Administration (NHTSA) included an assessment of impacts to equity-focus communities in the Final Supplemental EIS of proposed Corporate Average Fuel Economy (CAFE) Standards,[3] focusing both on environmental justice communities (Chapter 7: Other Impacts) and health, societal, and environmental impacts of climate change (Chapter 8: Cumulative Impacts). The analysis was informed by recent Executive Orders and U.S. DOT orders to consider an expansion of environmental justice analysis and designating specific populations as belonging to environmental justice communities.
The scope of this study was much broader and somewhat different than for a typical transportation project; however, it does provide an example of consideration of the environmental justice impacts related to potential climate change effects of a transportation action. The affected environment for the analysis was the United States. The analysis was informed by a literature review identifying where environmental justice communities would be most likely exposed to the environmental and health effects of oil production, distribution, and consumption or the impacts of climate change. NHTSA’s analysis drew largely from recent studies and reports, including Intergovernmental Panel on Climate Change (IPCC) and Global Change Research Program (GCRP) reports. This review identified the following potential impacts to which environmental justice populations faced disproportionate exposure:
- Proximity to oil refineries, which could be correlated with higher incidences of cancer and leukemia.
- Proximity to high-traffic roadways, which could result in adverse cardiovascular and respiratory impacts.
- Increases in global temperature, which can lead to an increased number and severity of vector-borne illnesses.
- Ambient air pollution, which is associated with negative health effects to which environmental justice populations may experience a higher degree of suffering.
- Lower level of access to the distributed benefits of electric vehicles.
These areas of potential impact were identified qualitatively based on the review of the literature, which found a preponderance of evidence that these impacts were disproportionately distributed to environmental justice populations.
Impacts to environmental justice populations were also considered in the cumulative impacts analysis, focusing on a timeframe from 2040 to 2050. The analysis focused on potential impacts associated with global light-duty vehicle market trends, especially within the United States. Impacts to environmental justice populations were qualitatively assessed based on increased electric vehicle (EV) usage, reduced direct land disturbance resulting from oil exploration and extraction, and decreased air pollution. The analysis reasoned that implementation of the Proposed Action would result in cumulative impacts to environmental justice communities to the extent that those communities live closer to areas of potential impact or experience greater levels of exposure to climate-related impacts. Implementation of the Proposed Action was expected to reduce disproportionate pollution impacts on overburdened communities.
The health, societal, and environmental impacts of climate change also provided consideration for equity-focus communities beyond the environmental justice communities addressed by Executive Order 12898 and U.S. DOT Order 5610.2(c), both with a focus on sector-specific impacts of climate change and region-specific impacts of climate change. This analysis considered equity-focus communities in a global context.
5.4.3 Resources for Outreach to Environmental Justice and Equity-Focus Communities
A number of resources have been published on engaging disadvantaged communities, including environmental justice populations, in transportation planning, project development, and environmental review. These resources are directly relevant to the consideration of GHG emissions and climate change effects as well. Examples include:
- FHWA (2006). How to Engage Low-Literacy and Limited-English-Proficiency Populations in Transportation Decisionmaking.
- FHWA (2015b). Public Involvement Techniques for Transportation Decision-Making.
- FHWA (2016c). Climate Change and Environmental Justice: Considerations for Transportation Decision-making.
- FHWA (2017b). Developing and Advancing Effective Public Involvement and Environmental Justice Strategies for Rural and Small Communities.
- FHWA (2022a). Virtual Public Involvement.
- FHWA (2022b). Promising Practices for Meaningful Public Involvement in Transportation Decision-Making.
- Morris and Fragala (2010). NCHRP Synthesis 407: Effective Public Involvement Using Limited Resources.
- Salerno et al. (2019). NCHRP Synthesis 538: Practices for Online Public Involvement.
- Twaddell and Zgoda (2020). TCRP Research Report 214: Equity Analysis in Regional Transportation Planning Processes.
- U.S. EPA (2013). Model Guidelines for Public Participation: An Update to the 1996 NEJAC Model Plan for Public Participation.
Appendix A contains additional descriptions of each resource.
5.5 Communicating Findings and Drawing Conclusions
Both before and after an agency has conducted an analysis of the potential effects that climate change may have on a particular project or geographic area, it is important to consider the best methods for communicating those findings to the public and to determine how the information should be used. For example, do the climate change effects amount to “significant” effects? Do they warrant mitigation measures, or are adequate resilience measures already built into the project design alternatives?
As discussed previously in this guide, meaningful community engagement is best carried out not only as part of the environmental review process but also well in advance of this process, such as during early planning phases. Transportation agencies undertaking planning efforts either at programmatic or project levels should work to engage the public, particularly communities that may be most affected by the plans or projects under consideration, to determine local needs and priorities and have two-way communication regarding the anticipated climate change effects for the region and lived experiences of community members.
Resources are available that draw on the latest social science to help agencies communicate with different audiences about climate change. One such resource specifically of use to transportation agencies is the Caltrans Climate Change Communication Guide (Caltrans 2020b). The Caltrans guide includes recommendations and best practices that transportation agencies can apply when communicating internally, with external partners, and with the public regarding information about climate change. For example, in engaging with members of the public, the Caltrans guide recommends tailoring messages to the audience with sensitivity to cultural, educational, and political backgrounds, using storytelling, focusing on local impacts, and using effective visualizations.
Many of the tools included in Appendix B can be used to support communication of a particular climate effect or be used to explain why a project area is being studied further. For example, the National Oceanic and Atmospheric Administration (NOAA) National Centers for Environmental Information (NCEI) County Time Series can be used to show changes in historical temperature at a county level to explain why certain climate effects are being studied in greater detail (Figure 5‑7). Trend data may not accurately represent likely impacts in the future, but it can help to connect lived experience with changing conditions.
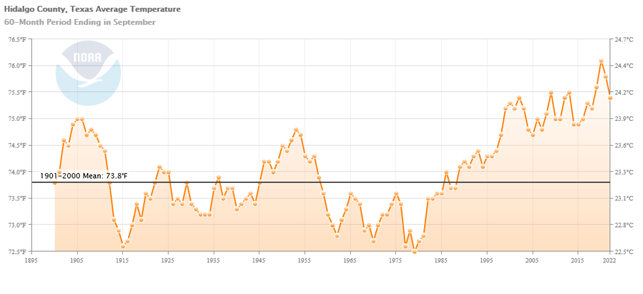
Source: NOAA (2022). NCEI Climate at a Glance: County Time Series
Programmatic evaluations of climate change effects can help agencies determine which projects or geographic areas may be most likely to experience meaningful climate change effects and warrant mitigation measures or integration of resilience in project design alternatives. Considerations that may be relevant in making these determinations include specific findings from the vulnerability assessment, such as areas where highly critical assets overlap with greater exposure to climate change effects, whether climate change is likely to affect the project’s performance over its design life; and the presence of communities that may be disproportionately affected by climate change effects or who may experience negative effects from transportation projects.
A climate change effects analysis may be included within an Indirect and Cumulative Effects Section of an environmental document or an Indirect and Cumulative Effects Report or appendix. In some cases climate change effects have also been described within the Air Quality section, report, or appendix. A sample outline for a section on climate change effects is shown in Sidebar 5-5:
Sidebar 5-5: Sample Outline of Climate Change Effects Report
1. Introduction a. Brief description of project and its purpose and need. b. Brief description of alternatives, including No-Build.
2. Climate Change a. Brief description of the greenhouse effect and climate change. b. Brief description of climate change effects expected: i. Statewide. ii. Project area/region. c. Basis for expected climate change effects: i. Climate Action Plan, if any. ii. Statewide or regional vulnerability assessment, if any.
3. Project Setting a. Brief description of consideration of project alternatives on various climate change effect parameters (e.g., highway runoff, sea-level rise flooding). b. If quantified, provide a brief description of expected climate impacts in the project area (e.g., inches of sea-level rise, frequency of extreme rainfall events). c. Brief description of statewide resilience planning efforts. i. Application of statewide resiliency efforts to project area.
4. Analysis Outcome a. Brief description of any Department-wide instructions to design or maintenance practice changes as a result of climate change expected impacts. i. Application of changed design or maintenance practices to the project. b. Brief description of project-specific features (e.g., design, operational, maintenance) to account for expected climate change effects, if any. i. If quantified, detail of project-specific changes (e.g., inches/feet increase in bridge height to account for more frequent flooding). c. Consideration of the project’s potential to exacerbate or mitigate climate change effects. i. Mitigation measures considered and implemented to reduce or eliminate project-induced climate change effects exacerbation. d. Discussion on project-specific equity/environmental justice assessments and implemented strategies.
5. Conclusion
a. An overall conclusion regarding the projected effects of climate change on the project and project area, and the effect of the project on the resilience of the project area/region under the preferred alternative.
b. Discussion of project vulnerability and resilience, as well as consistency with resilience and adaptation plans.
5.6 Mitigation Measures
In the context of climate change planning and analysis, the term “mitigation” is often used to refer to reducing GHG emissions. This usage is in contrast to “adaptation,” which refers to making adjustments to natural or human systems in response to actual or expected climate changes. However, “mitigation” can also refer to mitigating the effects of climate change on the project or on the project area (as related to the project).
As described in Section 4.7, CEQ guidance for mitigation includes avoiding impacts, minimizing impacts by limiting them, rectifying impacts, reducing or eliminating impacts, or compensating for impacts. The CEQ’s interim 2023 guidance instructed agencies to evaluate reasonable alternatives and mitigation measures and to address both short- and long-term climate effects. Further, the guidance recommends referring to agencies’ own climate goals for context, the importance of considering alternatives, and mitigation (CEQ 2023a).
In general, mitigation measures can be included as part of the project design or after the project design is completed. Mitigation of climate change effects is increasingly considered during project design (including stages of design that occur before and after environmental review), with some states requiring that projects have a beneficial contribution to improving resilience. The interim 2023 CEQ guidance acknowledges that mitigation may be included within the proposed action or alternatives.
Some key questions to help identify potential mitigation strategies include:
- What climate change studies and data are available for the project area or region?
- What is the expected useful life of the project?
- How critical is the project, and what types and magnitude of climate risk are acceptable?
- How might climate change affect the project?
- How might the project interact with the effects of climate change to further affect the project environment?
- What measures can address the potential impacts of climate change on the project or in the project area?
- What is the likelihood of a particular climate change effect, and how does that likelihood change over time?
- Given the project’s expected useful life, the likelihood of specific climate change effects over time, and the projected climate change risk tolerance, what climate parameters should be considered in developing a resilient project design (e.g., how many inches/feet of sea level rise)?
- What measures could be implemented as part of project design, construction, operation, and maintenance to reduce climate risks and improve resilience?
- Which of the resilience measures identified are feasible, practicable, and proposed for implementation?
- Are there benefits to considering a dynamic adaptive pathways approach to addressing the project vulnerability to climate change, given future uncertainties? What thresholds or trigger points might be appropriate? (The dynamic adaptive policy pathways approach develops a series of actions over time based on the idea of making decisions as conditions change.)
- What opportunities are available for incorporating nature-based solutions, Indigenous knowledge, and input from environmental justice communities and other stakeholders?
- How do the proposed measures to improve resilience affect environmental justice communities and other stakeholders?
- With the implementation of proposed resilience measures, what climate vulnerabilities would remain? Are the remaining vulnerabilities disproportionately located in environmental justice or equity-focus communities?
- What adverse or beneficial effects would the project have on system-wide (e.g., transportation system) or community/region-wide resilience?
- How should mitigation measures be located relative to environmental justice or equity-focus communities?
- How should the implementation and effectiveness of mitigation measures be tracked as part of a project’s environmental commitments?
Due to the varied and evolving nature of climate change, identifying appropriate and effective mitigation measures can be a challenge. Tracking the effectiveness and outcomes of mitigation measures can also be a challenge, particularly given the timescale of consideration, and there is limited precedent for consideration of mitigation specific to environmental justice communities (whether for climate or other environmental effects).
The interim 2023 CEQ guidance indicates that agencies should solicit input on potential mitigation measures, including from communities that the proposed action and reasonable alternatives may affect. As part of the North Houston Highway Improvement Project, The Texas Department of Transportation (TxDOT) conducted extensive multi-year community outreach while developing a resilient design to function during extreme weather events (TxDOT 2020). The project design included extensive drainage and flood control measures in coordination with the City of Houston and Harris County Flood Control District. Additional resiliency enhancements for flood control, drainage, and overall project design were made as a result of public engagement, which included interactive pop-ups at community events (TxDOT 2020). TxDOT has found that meeting people where they are—attending a meeting at their local community center or other gathering place—to be a simple and effective strategy that accommodates scheduling issues and other barriers often faced by environmental justice communities.
In a sample of 21 EIS and EA documents reviewed (see Appendix C), no examples were found in which specific climate effect mitigation measures were quantified. Where present, documents made general statements that climate effects could be reduced during the construction phase and that mitigation measures might be modified as a result of anticipated climate effects.
Based on NEPA’s 40 most asked questions, FHWA notes that “The mitigation of impacts must be considered whether or not the impacts are significant.”[4] It can therefore be considered good practice to include climate change effects mitigation measures in the environmental review for a project, despite the lack of a significance threshold or determination.
Some potential mitigation measures that could be considered either in project design or as a separate measure include:
- Locating the project to avoid further fragmentation and degradation of floodplain hydrology.
- Restoring unused impervious areas to support better floodwater management, wildlife habitat, and vegetation.
- Adding green infrastructure to build resilience against heat effects, drought, and storms.
- Supporting climate-resilient transit-oriented development in the area.
- Designing the project to avoid fracturing changing ecosystems (e.g., by providing fish passages or wildlife crossings).
- Integrating stormwater management processes that consider changing conditions.
- Offsetting wetlands loss with wetlands restoration or banking in other locations.
- Designing a project in a tidal/coastal area to restore tidal flow and create more marsh area.
5.7 Examples in Practice
The examples provided below can serve as a guide to state DOTs that are seeking to develop approaches for their agency to consider climate change effects in environmental reviews. Other state DOTs could assess the studies, determine how they apply to their state and project conditions, and develop approaches and language as appropriate. Since practice on this topic is rapidly evolving, readers should consider these examples as illustrative rather than intended to be emulated. Any approach should be applicable to their state’s climate change policies and requirements as well as to the project’s purpose and need and the alternatives under consideration. Careful thought should be applied to the use of standard approaches or language in project environmental reviews to ensure that the language adapted from the template statement matches the project circumstances. For example, if the project area is subject to flooding from sea-level rise, the template language should be adapted to discuss the state’s known assessments of sea-level rise and how the state has determined to adapt to those sea-level rise assessments.
5.7.1 Washington State DOT and the I-5 Columbia River Crossing
WSDOT has provided guidance for identifying project-level climate change effects under NEPA and SEPA since 2009.
The I-5 Columbia River Crossing Project EIS (Oregon DOT and Washington State DOT 2011) evaluated climate change effects specific to the region, including temperature and precipitation changes, altered seasonal river flow, and increased flooding. Projected climate effects in the project area included:
- Increased average annual air temperatures as a result of natural and human-caused climate change.
- Warmer winter temperatures in the Columbia River Basin that would result in lower snowpack and higher winter baseflows.
- Lower base flows in the spring and summer months that would increase the likelihood of more intense storms that could lead to more flooding.
- Sea level rise increasing at a rate similar to the average annual increase of 1.3 feet by 2100.
- Decreasing salmon and trout populations in the Columbia River basin; however, these impacts would be less severe than impacts from human activities such as the destruction or degradation of freshwater habitat.
The vulnerability and resilience assessment included an evaluation of impacts and GHG emissions, and was done in coordination with the University of Washington’s Climate Impacts Group to identify both project effects and mitigation strategies.
Ultimately, the final design of the locally preferred alternative changed from the Draft Environmental Impact Statement (DEIS) to the FEIS to accommodate the projected climate-change induced rise in the Columbia River’s water levels. The final design incorporated two bridges (instead of three) as well as an uncommon bridge design that featured light rail transit and a multiuse pathway running beneath the highway deck. The design change enabled the bridge to be completed with fewer piers with less in-water structure, and smaller surface area that would generate stormwater runoff.
In addition to this design change, the project also sought to consider the anticipated effects of climate change and to incorporate elements that would improve the project’s resilience to climate impacts by 1) avoiding impacts to floodplains by transportation and utility project components and 2) improving regional water quality through stormwater management by restoring existing unused impervious paved areas (to the extent practical). Though not a project commitment, project sponsors also identified an opportunity to improve the project’s ability to withstand climate change-induced impacts by integrating adaptive climate change features and performance mechanisms into the design of the project.
5.7.2 Arizona DOT and the Sonoran Corridor Study
The Arizona DOT EIS for the Sonoran Corridor Study[5] evaluated climate effects including extreme heat, freeze-thaw, extreme precipitation, wildfire, and the change in risk factors over time.
Through FHWA’s Climate Change Resilience Pilot Program pilot, the EIS incorporated the FHWA Vulnerability Assessment Framework into the EIS, following the steps identified in that document, including: (1) gathering information on potential extreme weather impacts, (2) collecting data for transportation facilities and land cover characteristics, and (3) integrating the datasets to perform a high-level assessment of potential infrastructure vulnerabilities. An assessment of the potential impact of various climate effects is shown in Table 5-6.
Table 5-6. Sonoran Corridor EIS Vulnerability Assessment
| Climate Effect | Potential Impact | Assessment | Likely Impact |
| Extreme temperature | • Pavement deformation due to thermal expansion (heat) • Impacts to construction schedules and seasons (heat) • Changes to maintenance and operations (heat) • Unsafe conditions for workers (heat) • Operations and maintenance costs (freezing) | • Increase in the number of extreme heat events in Phoenix and Tucson • Decrease of freezing events | • Negative impact associated with increase in extreme heat • Positive impact associated with freezing events |
| Extreme precipitation | • Flooding/inundation • Mudslides | • Not stated | • Neutral effect in Phoenix and Tucson Districts — results have a lower level of confidence |
| Wildfires | • Interrupting operations • Aggravating flooding or drainage failures | • Low risk of wildfire events and negligible potential climate-induced increase in events | • Increased risk for wildfire events in the Tucson District — results are uncertain over the long-term |
Source: Arizona DOT 2021[5]
5.7.3 Oregon DOT and the Multnomah County Earthquake Ready Burnside Bridge Project
The Multnomah County Earthquake Ready Burnside Bridge (EQRB) Project was conducted to create a seismically resilient Burnside Bridge lifeline crossing for the City of Portland over the Willamette River in the event of an earthquake (Oregon DOT and Multnomah County 2021). It is unusual among the projects reviewed in that its Purpose and Need is itself focused on increasing the community’s resilience. The project is located in the Cascadia Subduction Zone (CSZ), an area subject to powerful, frequent earthquakes. All of the other bridges across the Willamette River are expected to collapse in the event of a CSZ earthquake (Figure 5‑8) or would pass under aging Interstate 5 overpasses that are similarly expected to collapse. As such, the Burnside Bridge is designated as a Primary East-West Emergency Transportation Route by the Regional Disaster Preparedness Organization.
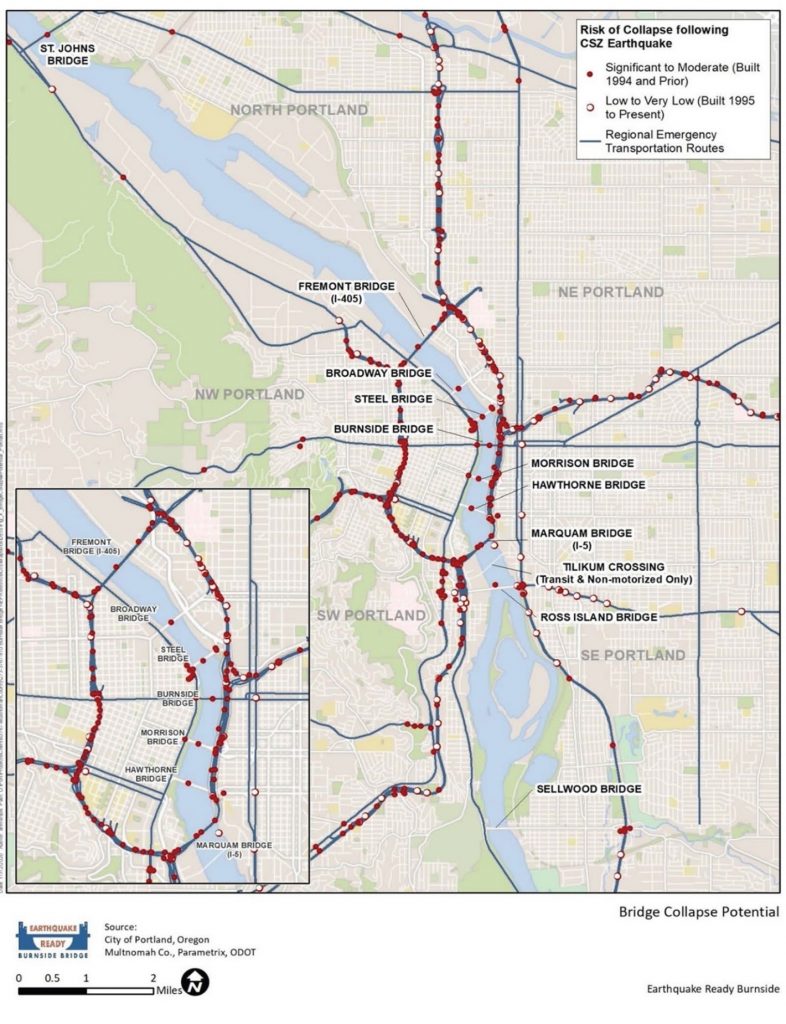
Source: Oregon DOT and Multnomah County (2021)
The EQRB DEIS Project Climate Change Technical Report (Oregon DOT and Multnomah County 2021) includes a detailed analysis of both the project’s contribution to climate effects and the impacts to the project from climate effects. The climate effects considered include sea-level rise, changes in precipitation patterns and weather events, runoff and associated flooding, increases in average summer temperatures, increased frequency of high-heat days, reduced summer streamflow (as a result of diminishing winter snowpack and seasonally drier conditions), warmer winters, decreased incidence of cold extremes, increased and more variable streamflow in the winter (as a consequence of more intense rain events), increased precipitation (especially in large quantities over a relatively short duration), increased urban flooding events, increased groundwater levels, increased river levels, and heightened risk of landslides.
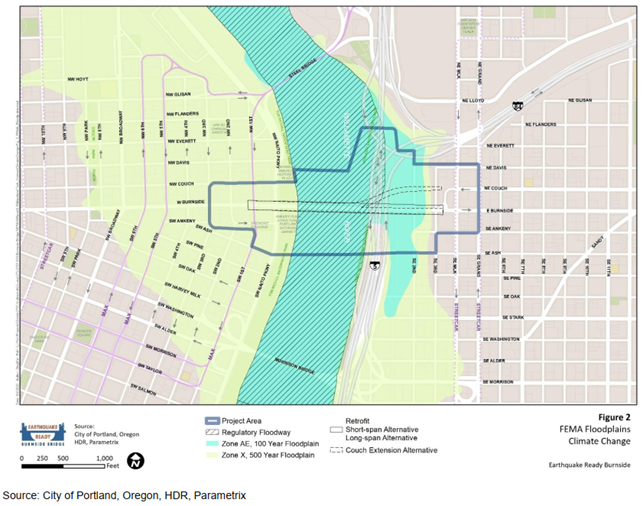
Table 5‑7 provides details on data sources used to support the Climate Change Technical Report and the analysis that each source supported. The analysis was informed by a mix of both analytical tools, such as the USGS Flood Inundation Mapping Program; as well as previously completed planning documents, such as the Fourth Oregon Analysis completed for the project that identified an Area of Potential Impact for the climate change analysis that differed slightly from traditional resource contexts. At the local level, the Willamette River and streambanks within Multnomah County were considered part of the Area of Potential Impact for climate effects on the project, and to account for potential future changes in floodplain levels associated with the Willamette River. The project footprint and nearby floodplain areas are shown in Figure 5‑9.
Table 5-7. Data Sources Used to Evaluate Climate Effects for Burnside Bridge
| Published Sources and Data | Purpose |
| The USGS Flood Inundation Mapping program | Estimate river flow data and flood forecasts to understand potential flooding scenarios for the Project Area. |
| The Greenroads® Rating System and comparable Greenroads-certified projects | Evaluate other transportation infrastructure projects’ environmental, social, and economic performance. |
| Hydraulic modeling completed by the U.S. Army Corps of Engineers and USGS (assessments of Columbia and Willamette River flood stage on the Columbia Corridor Levee System) | Impact analysis of potential extreme weather events due to climate change on Willamette River levels. |
| The Fourth Oregon Climate Assessment Report (2019) by the Oregon Climate Change Research Institute | Present the state of knowledge of climate science as it pertains to Oregon and the project. |
| The 2012 ODOT Climate Change Adaptation Strategy Report | Evaluate the current conditions and the impact of climate change on the existing bridge and the infrastructure in the Project Area. |
Source: Oregon DOT and Multnomah County (2021)
Source: Oregon DOT and Multnomah County (2021)
Existing conditions included climate change-related policies and their impact on policies for the GHG effects. For other climate effects, including primarily water levels and flooding, the analysis was based on current and past conditions.
Environmental consequences focused primarily on GHG emissions. Other climate effects focused primarily on the impacts of flooding. The analysis simulations suggested that future flood stages influenced by climate change effects would not increase river levels so much that the current bridge or any Build Alternative bridge would be affected with the exception of the bridge approaches, which could be affected.
5.7.4 Virginia DOT–Text for Climate Change: Considerations Relating to the Affected Environment
The Virginia DOT has developed template text suitable for inclusion in project-level environmental documentation, describing considerations relating to the affected environment (Virginia DOT 2022a). The text is approximately two to three pages, depending on which studies are relevant and referenced, and includes:
- A section generally describing the expected impacts of climate change and referencing to a state-specific assessment developed by the Georgetown Climate Center, “Understanding Virginia’s Vulnerability to Climate Change.”
- A section describing project-level climate strategies and considerations. This section references statewide resiliency planning efforts undertaken by VDOT as well as regional assessments developed by regional agencies that may be applicable to projects depending upon their location.
[1] Delaware DOT (2022). Transportation Resiliency and Sustainability. https://deldot.gov/Programs/trs/
[2] U.S. DOT (2015). Transportation Climate Change Sensitivity Matrix. https://www.fhwa.dot.gov/environment/sustainability/resilience/tools/index.cfm
[3] NHTSA (2022). Final Supplemental Environmental Impact Statement for Model Year 2024–2026 Corporate Average Fuel Economy Standards. https://www.nhtsa.gov/sites/nhtsa.gov/files/2022-04/Final-SEIS-Complete_CAFE-MY-2024-2026.pdf
[4] FHWA (n.d.) NEPA Transportation Decisionmaking. https://www.environment.fhwa.dot.gov/nepa/trans_decisionmaking.aspx
[5] Arizona Department of Transportation and U.S. Department of Transportation, Federal Highway Administration (2021). Final Tier 1 Environmental Impact Statement and Record of Decision. https://azdot.gov/planning/transportation-studies/sonoran-corridor-sr-410-study/sonoran-corridor-sr-410-tier-1-environmental-impact-statement